851
Views
15
CrossRef citations to date
0
Altmetric
Original Articles

Assessment of Glucosinolates in Chinese Kale by Near-Infrared Spectroscopy

, , , , , & show all
Pages 1668-1679 | Received 07 Jan 2012, Accepted 24 Feb 2012, Published online: 24 Apr 2014

Figures & data

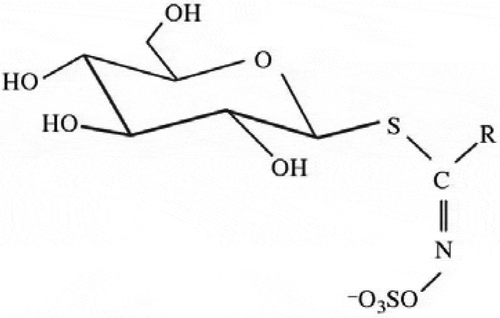
Figure 1 General structure of glucosinolates.

Figure 1 General structure of glucosinolates.

Figure 2 HPLC chromatogram of glucosinolates. (a) Internal standard TRO. (b) Glucosinolates in a sample.
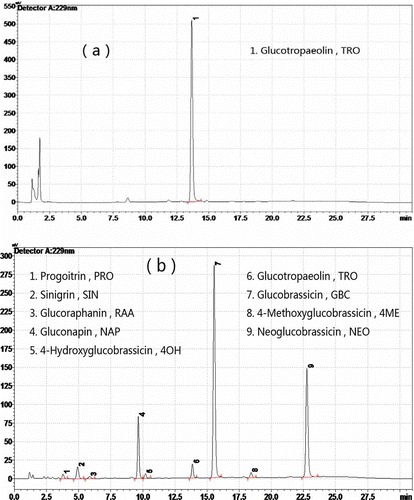
Figure 2 HPLC chromatogram of glucosinolates. (a) Internal standard TRO. (b) Glucosinolates in a sample.

Figure 3 Frequency distribution plots (μmol g dw−1). (a) Total glucosinolates. (b) Progoitrin. (c) Sinigrin. (d) Glucoraphanin. (e) Gluconapin. (f) 4-Hydroxyglucobrassicin. (g) Glucobrassicin. (h) 4-Methoxyglucobrassicin. (i) Neoglucobrassicin.
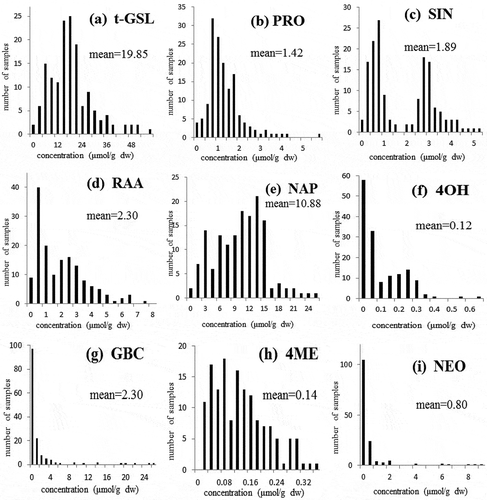
Figure 3 Frequency distribution plots (μmol g dw−1). (a) Total glucosinolates. (b) Progoitrin. (c) Sinigrin. (d) Glucoraphanin. (e) Gluconapin. (f) 4-Hydroxyglucobrassicin. (g) Glucobrassicin. (h) 4-Methoxyglucobrassicin. (i) Neoglucobrassicin.

Figure 4 Raw spectra (log 1/R) of the samples of Chinese kale used in this study (n = 150) in the range 400 to 2500 nm.
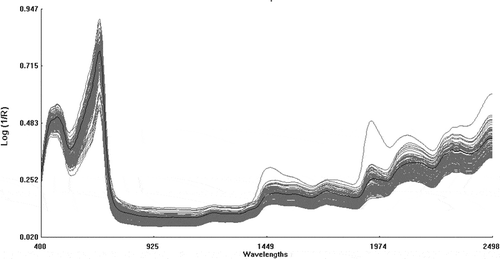
Figure 4 Raw spectra (log 1/R) of the samples of Chinese kale used in this study (n = 150) in the range 400 to 2500 nm.

Table 1 NIRS calibration and validation statistics for the different equations developed for glucosinolates

Figure 5 Second derivative spectra (2, 5, 5, 2; SNV + DT) of the raw optical data in the range 400 to 2500 nm.
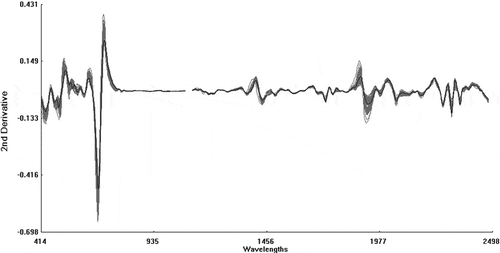
Figure 5 Second derivative spectra (2, 5, 5, 2; SNV + DT) of the raw optical data in the range 400 to 2500 nm.

Figure 6 Scatter plots (n = 30). (a) Total glucosinolates. (b) Progoitrin. (c) Sinigrin. (d) Glucoraphanin. (e) Gluconapin. (f) 4-Hydroxyglucobrassicin. (g) Glucobrassicin. (h) 4-Methoxyglucobrassicin. (i) Neoglucobrassicin. Abscissa axis: laboratory values of glucosinolates by HPLC (μmol g dw−1); vertical axis: predicted values of glucosinolates by NIRS (μmol g dw−1).
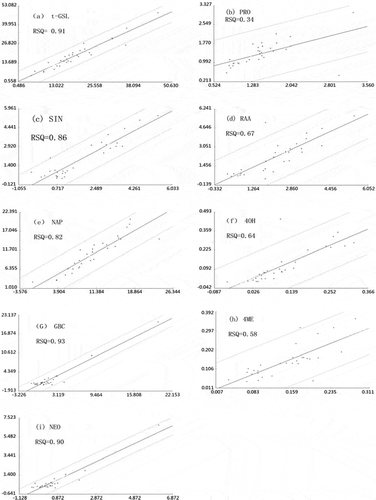
Figure 6 Scatter plots (n = 30). (a) Total glucosinolates. (b) Progoitrin. (c) Sinigrin. (d) Glucoraphanin. (e) Gluconapin. (f) 4-Hydroxyglucobrassicin. (g) Glucobrassicin. (h) 4-Methoxyglucobrassicin. (i) Neoglucobrassicin. Abscissa axis: laboratory values of glucosinolates by HPLC (μmol g dw−1); vertical axis: predicted values of glucosinolates by NIRS (μmol g dw−1).
Reprints and Corporate Permissions

Please note: Selecting permissions does not provide access to the full text of the article, please see our help page How do I view content?

To request a reprint or corporate permissions for this article, please click on the relevant link below:

Academic Permissions

Please note: Selecting permissions does not provide access to the full text of the article, please see our help page How do I view content?

Obtain permissions instantly via Rightslink by clicking on the button below:

If you are unable to obtain permissions via Rightslink, please complete and submit this Permissions form. For more information, please visit our Permissions help page.