Figures & data
Figure 1 Systematic scheme for extraction of crude catechins.
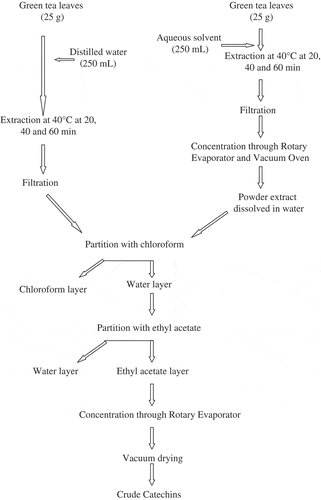
Table 1 Composition of green tea
Table 2 Extraction yield of EGC, EGCG, ECG, and EC (g/100 g of dry extract)
Figure 2 Extraction yield of catechins (mg/100 g green tea).
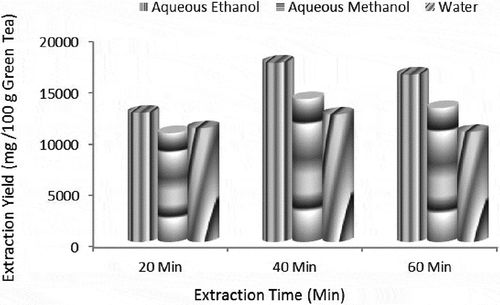
Figure 3 Chromatogram of (a) standards (EGC, EGCG, EC, and ECG), (b) aqueous ethanol at 40 min, (c) aqueous methanol at 40 min, and (d) water at 40 min.
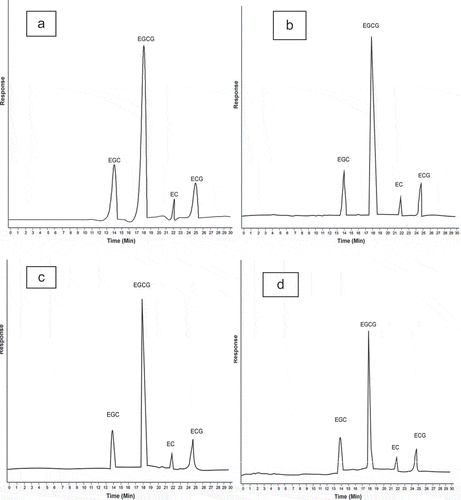
Figure 4 DPPH radical scavenging activity of extracted catechins. Means differed significantly at P < 0.05.
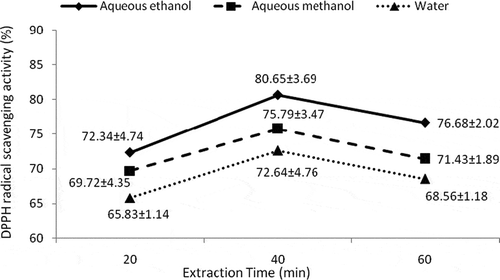
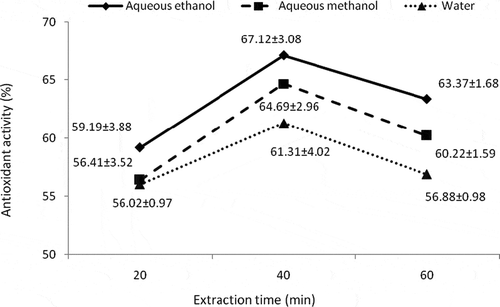
Figure 5 Antioxidant activity of extracted catechins. Means differed significantly at P < 0.05.