Figures & data
Table 1 Design parameters for osmotic dehydration
Figure 1 Flow diagram of the used experimental protocol.
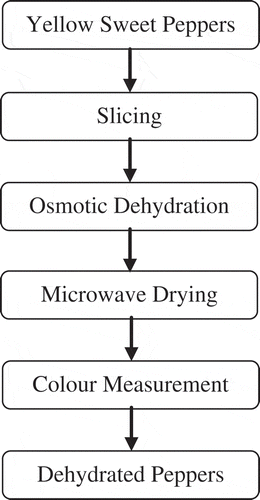
Figure 2 Experimental microwave-air drying apparatus.
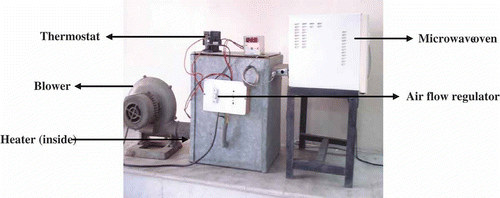
Table 2 The estimated kinetic parameters and the statistical values of zero-order and first-order models for L, a, b, and total color change (ΔE) for various microwave output powers
Table 3 The estimated kinetic parameters and the statistical values of zero-order and first-order models for chroma, hue angle, and Browning index for various microwave output powers
Figure 3 Kinetics of change of L value as a function of drying time at 1.4, 1.05, 0.70, and 0.35 W/g of microwave output powers and at temperatures of 60, 45, and 30°C.
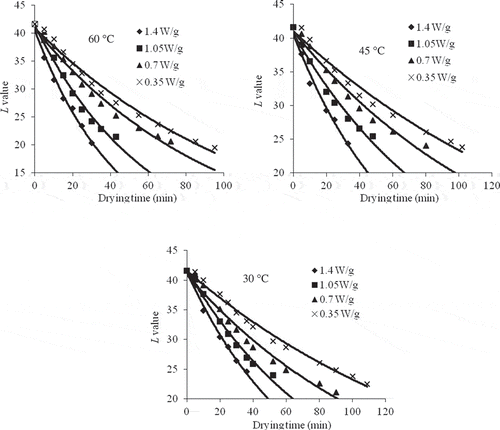
Figure 4 Kinetics of change of b value as a function of drying time at 1.4, 1.05, 0.70, and 0.35 W/g of microwave output powers and at temperatures of 60, 45, and 30°C.
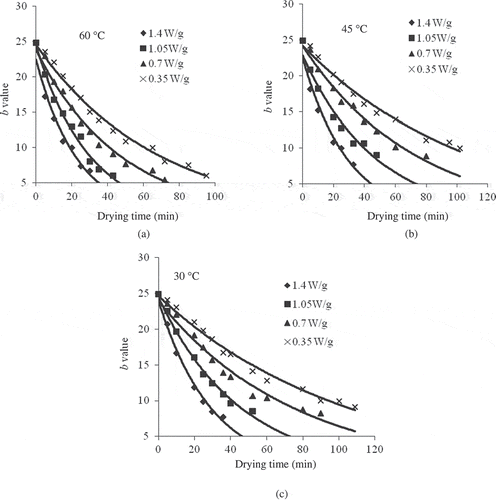
Figure 5 Kinetics of change of a value as a function of drying time at 1.4, 1.05, 0.70, and 0.35 W/g of microwave output powers and at temperatures of 60, 45, and 30°C.
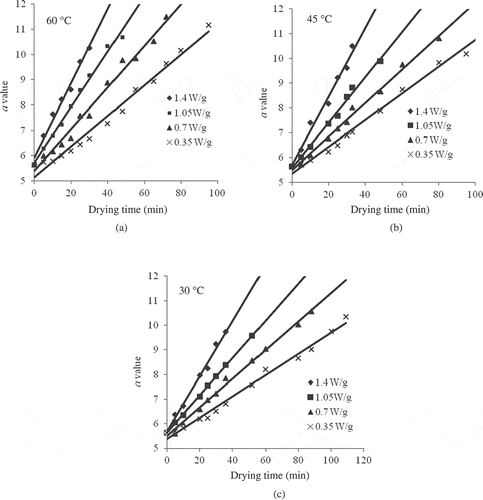
Figure 6 Kinetics of change of ΔE value as a function of drying time at 1.4, 1.05, 0.70, and 0.35 W/g of microwave output powers and at temperatures of 60, 45, and 30°C.
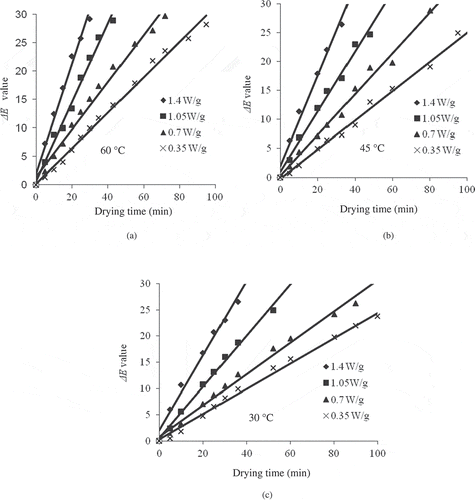
Figure 7 Kinetics of change of chroma value as a function of drying time at 1.4, 1.05, 0.70, and 0.35 W/g of microwave output powers and at temperatures of 60, 45, and 30°C.
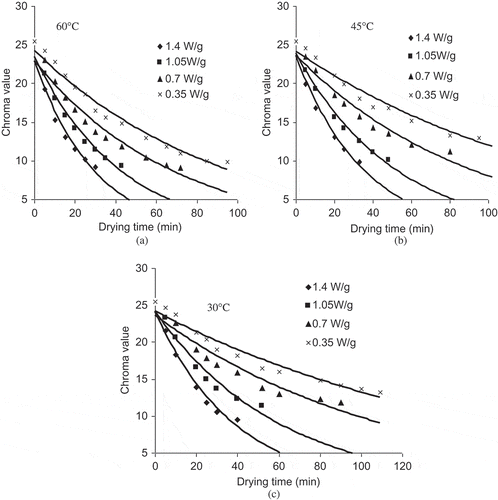
Figure 8 Kinetics of change of hue value as a function of drying time at 1.4, 1.05, 0.70, and 0.35 W/g of microwave output powers and at temperatures of 60, 45, and 30°C.
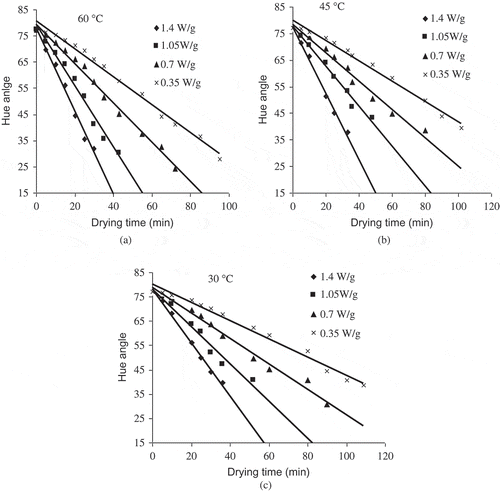
Figure 9 Kinetics of change of Browning index value as a function of drying time at 1.4, 1.05, 0.70, and 0.35 W/g of microwave output powers and at temperatures of 60, 45, and 30°C.
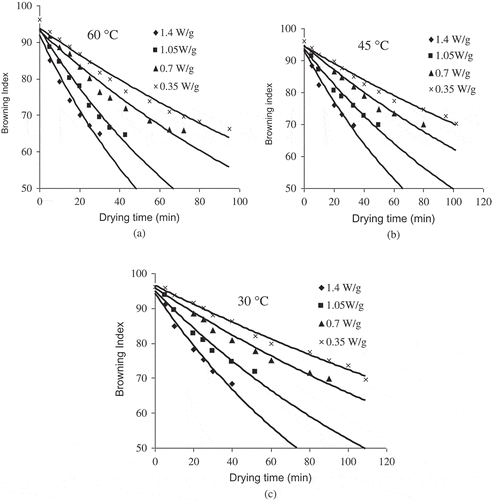
Table 4 Activation energies calculated for the color degradation for quality parameters
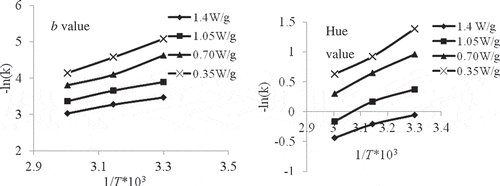
Figure 10 Arrhenius plots for loss of b and hue value for yellow color at different power levels.