4,382
Views
5
CrossRef citations to date
0
Altmetric
Original Articles

Estimation of Whole Volume of Green Shelled Mussels using their Geometrical Attributes Obtained from Image Analysis

&
Pages 1987-1997 | Received 25 Sep 2012, Accepted 06 Feb 2013, Published online: 23 Jun 2014

Figures & data

Table 1  The Nikon D300 camera control settings for back-lighting images

Figure 1 (a) Volume calculation by the cubic spline method. The black square is the size reference (4 cm × 4 cm). The divisions of the mussels, and the coordinates used to calculate the cross sectional areas (Eq. (5)) are shown. (b) The change of the total calculated volume of a mussel as affected by the number of divisions. After about 16 divisions, the calculated volume stabilizes. The volume of the same mussel, calculated based on two different images are also displayed. (c) Distribution of the calculated density frequency of the mussels used. (d) Volume calculated by cubic splines (using the combinations S1-T1 and S2-T2) versus the experimentally measured volume of the mussels.
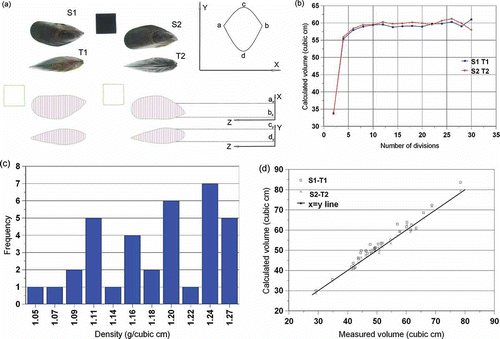
Figure 1 (a) Volume calculation by the cubic spline method. The black square is the size reference (4 cm × 4 cm). The divisions of the mussels, and the coordinates used to calculate the cross sectional areas (Eq. (5)) are shown. (b) The change of the total calculated volume of a mussel as affected by the number of divisions. After about 16 divisions, the calculated volume stabilizes. The volume of the same mussel, calculated based on two different images are also displayed. (c) Distribution of the calculated density frequency of the mussels used. (d) Volume calculated by cubic splines (using the combinations S1-T1 and S2-T2) versus the experimentally measured volume of the mussels.

Table 2  Parameters of the fitted equations to volume versus view area

Table 3  Prediction of whole volume by using the top and side view areas of mussels

Table 4  Parameters of the fitted equations to weight versus view area

Table 5  Parameters of the fitted equations to meat weight versus whole weight

Figure 2  (a) Length, width and thickness frequency distributions of the mussels, measured by image analysis. (b) Volume calculated by using Length, Width, and Thickness data using Eqns. 10, 11 and 12. (c) Distribution of the frequency of the condition index of the mussels, calculated by using Eq. (2). (d) Distribution frequency of the aspect ratio (length / width) of the S1, S2 views and T1, T2 views of the mussels.
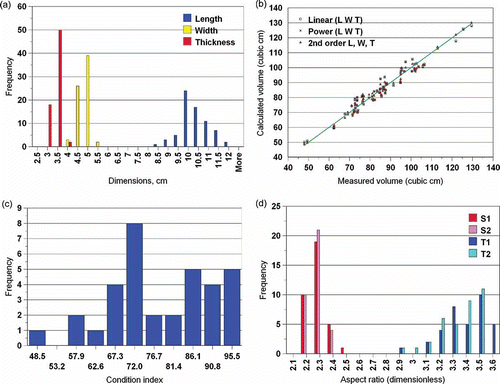
Figure 2  (a) Length, width and thickness frequency distributions of the mussels, measured by image analysis. (b) Volume calculated by using Length, Width, and Thickness data using Eqns. 10, 11 and 12. (c) Distribution of the frequency of the condition index of the mussels, calculated by using Eq. (2). (d) Distribution frequency of the aspect ratio (length / width) of the S1, S2 views and T1, T2 views of the mussels.
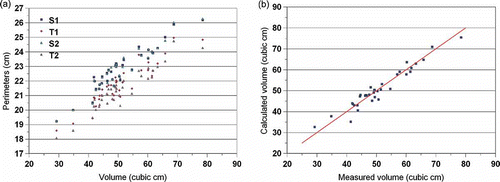
Figure 3 (a) Correlation between volume and perimeters of various view areas. (b) Volume calculated using Eq. (17) vs measured volume.

Figure 3 (a) Correlation between volume and perimeters of various view areas. (b) Volume calculated using Eq. (17) vs measured volume.

Reprints and Corporate Permissions

Please note: Selecting permissions does not provide access to the full text of the article, please see our help page How do I view content?

To request a reprint or corporate permissions for this article, please click on the relevant link below:

Academic Permissions

Please note: Selecting permissions does not provide access to the full text of the article, please see our help page How do I view content?

Obtain permissions instantly via Rightslink by clicking on the button below:

If you are unable to obtain permissions via Rightslink, please complete and submit this Permissions form. For more information, please visit our Permissions help page.