Figures & data
Table 1 RRO2 values ± standard deviation and RRO2 reduction percentage values (when temperature was decreased from 23 to 10°C) for each of the initial gaseous compositions assayed
Table 2 Analysis of variance table for respiration rate (RRO2) at 10, 19, and 23°C
Figure 1 Experimental O2 consumption rate (RRO2) as a function of O2 concentration, for the three temperatures assayed. Vertical bars represent standard deviation.
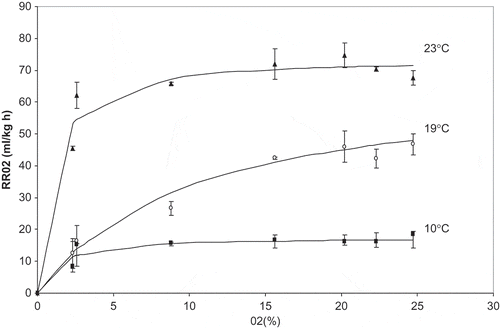
Table 3 Models tested on respiration rate data
Table 4 Model parameters for five combined Michaelis-Menten–Arrhenius models
Figure 2 RRO2 variation with temperature and O2 concentration. Surface plot represents model RRO2 values.
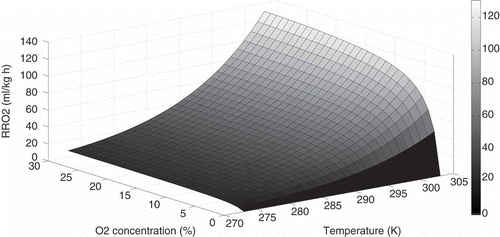
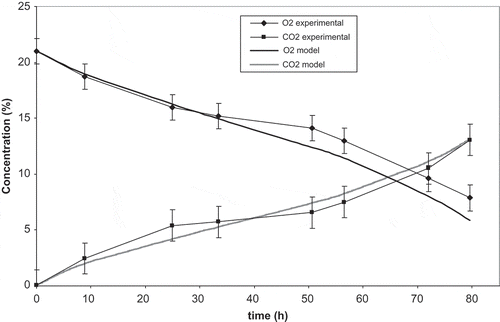
Figure 3 Experimental and model O2 and CO2 concentration evolution inside modified atmosphere packages of strawberries throughout 80 h storage in increasing temperature conditions.