Figures & data
Figure 1 Appearance and gel strength values of gelatin hydrogels treated with and without EGCG. Values are means (n = 5) ± standard deviation. Values in columns followed by same letter are not significantly different at α = 0.01.
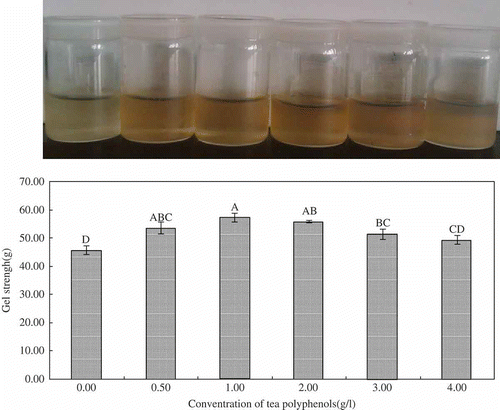
Figure 2 Calorimetric curves of gelatin xerogels treated with and without EGCG. (0) 0 g/l EGCG; (1) 0.5 g/l EGCG; (2) 1.0 g/l EGCG; (3) 2.0 g/l EGCG; (4) 3.0 g/l EGCG; (5) 4.0 g/l EGCG.
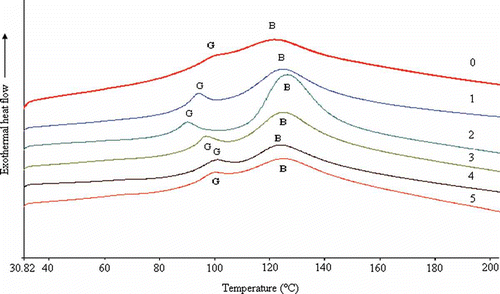
Table 1 The d values of diffraction peaks in X-ray diffraction diagrams of gelatin xerogels treated with and without EGCG
Table 2 Fourier transform infrared absorption band assignment of gelatin hydrogels treated with and without EGCG
Figure 3 X-ray diffraction diagrams of gelatin xerogels treated with and without EGCG. (0) 0 g/l EGCG; (1) 0.5 g/l EGCG; (2) 1.0 g/l EGCG; (3) 2.0 g/l EGCG; (4) 3.0 g/l EGCG; (5) 4.0 g/l EGCG.
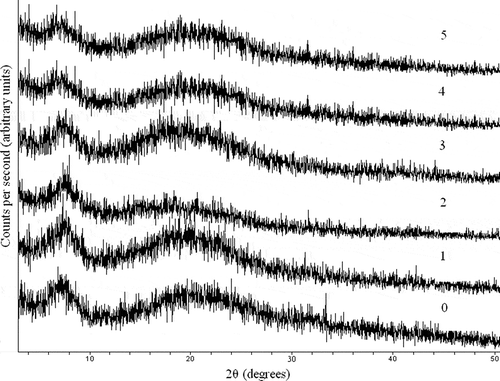
Figure 4 Fourier transform infrared spectrum of gelatin xerogels treated with and without EGCG. (0) 0 g/l EGCG; (1) 0.5 g/l EGCG; (2) 1.0 g/l EGCG; (3) 2.0 g/l EGCG; (4) 3.0 g/l EGCG; (5) 4.0 g/l EGCG.
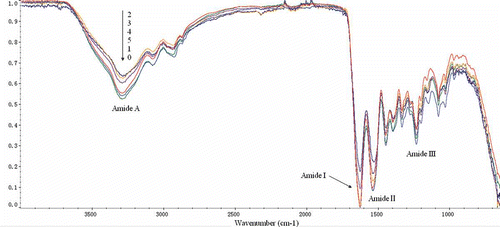
Figure 5 Second derivative of amide I band from FTIR spectra of gelatin xerogels treated with and without EGCG. (0) 0 g/l EGCG; (1) 0.5 g/l EGCG; (2) 1.0 g/l EGCG; (3) 2.0 g/l EGCG; (4) 3.0 g/l EGCG; (5) 4.0 g/l EGCG.
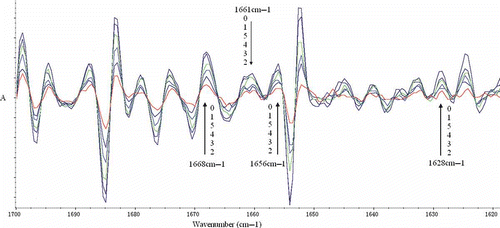
Figure 6 SDS-PAGE analysis of gelatin xerogels treated with and without EGCG. Lane C: Channel catfish skin collagen; Lane 0: 0 g/l EGCG; Lane 1: 0.5 g/l EGCG; Lane 2: 1.0 g/l EGCG; Lane 3: 2.0 g/l EGCG; Lane 4: 3.0 g/l EGCG; Lane 5: 4.0 g/l EGCG.
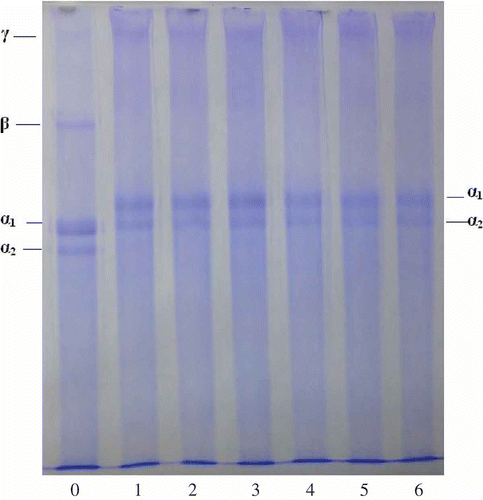
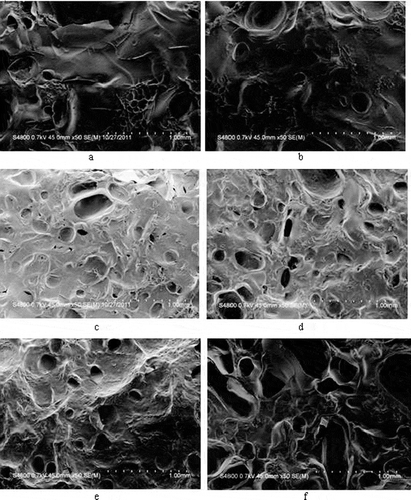
Figure 7 SEM surface images of gelatin xerogel treated with and without EGCG. (a) 0 g/l EGCG; (b) 0.5 g/l EGCG; (c) 1.0 g/l EGCG; (d) 2.0 g/l EGCG; (e) 3.0 g/l EGCG; (f) 4.0 g/l EGCG.