Figures & data
Table 1 Physicochemical parameters of honey
Figure 1 Typical rheogram of honey (A: elastic modulus; B: loss modulus; C: viscosity) at different temperatures: rhombus 5°C, square 10°C, triangle 15°C, multiplication symbol 20°C, cyrillic small letter zhe 25°C, circle 30°C, and plus 40°C.
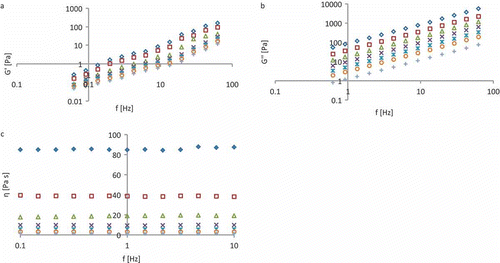
Table 2 Influence of temperature on honey viscosity
Table 3 Effect of °Brix concentration (C) on the honey’s viscosity at different temperature (T)
Table 4 Influence of the °Brix concentration on the viscosity’s activation energy
Figure 2 Variation of viscosity with temperature and °Brix concentration (spatial representation with representation by contours).
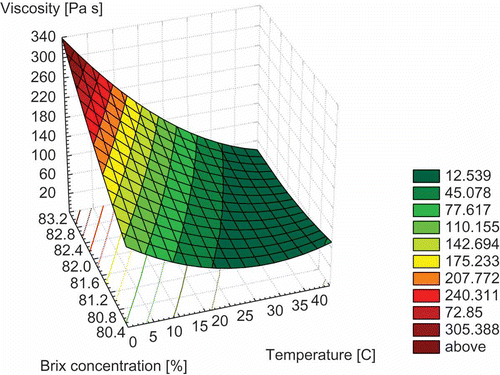
Table 5 Combined effect of °Brix concentration and temperature on the honey’s viscosity
Table 6 Correspondence between actual and coded values of design variables
Figure 3 Measured values vs. predicted values for honey’s viscosity.
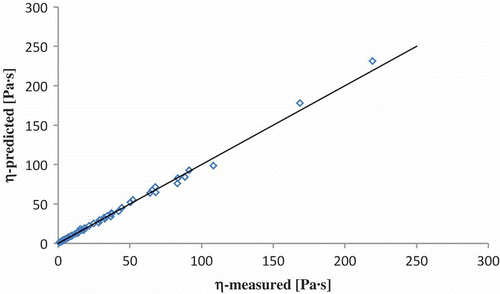
Table 7 Influence of temperature on honey loss modulus
Table 8 Effect of °Brix concentration (C) on the honey loss modulus at different temperature (T)
Table 9 Influence of the °Brix concentration on the loss modulus’s activation energy
Figure 4 Variation of loss modulus (G”) with temperature and °Brix concentration (spatial representation with representation by contours).
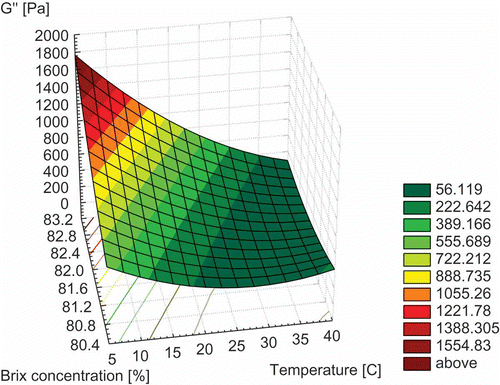
Table 10 Combined effect of °Brix concentration and temperature on the honey’s loss modulus
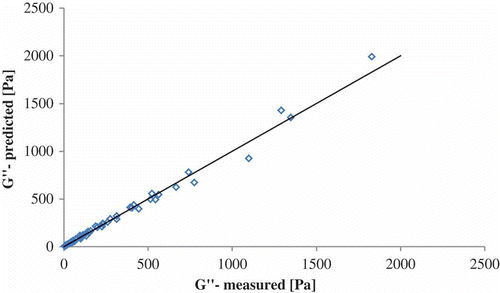
Figure 5 Measured values vs. predicted values for honey’s loss modulus.