Figures & data
TABLE 1 Effect of different methods on deproteinization and polysaccharide loss
FIGURE 1 The gel filtration chromatogram of crude S. cerviseae mannoprotein.
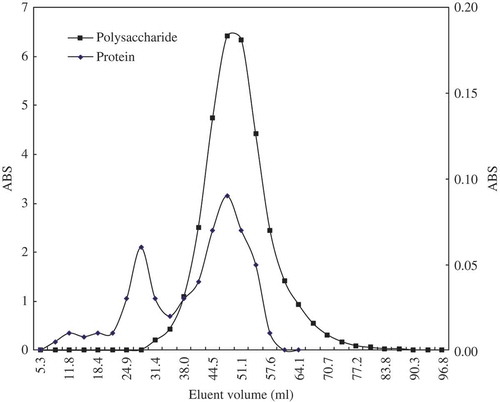
TABLE 2 Yeast and mannoprotein compositions
FIGURE 2 The FTIR spectra of S. cerviseae mannoprotein.
FIGURE 3 (A) 1H NMR spectra of S. cerviseae mannoprotein. (B) 13C NMR spectra of S. cerviseae mannoprotein.
TABLE 3 Amino acid analysis of S. cerviseae mannoprotein
FIGURE 4 (A) The two-dimensional image of S. cerviseae mannoprotein aquired by Atomic Force Microscope. (B) The three-dimensional image of S. cerviseae mannoprotein aquired by Atomic Force Microscope.
FIGURE 5 (A) The inhibition ratio of S. cerevisiae mannoprotein concentration effect to HepG2. (B) The inhibition ratio of S. cerevisiae mannoprotein concentration effect to HL-60. (C) The inhibition ratio of S. cerevisiae mannoprotein concentration effect to Ecal09. SMP: S. cerevisiae mannoprotein; DSMP: Degraded S. cerevisiae mannoprotein; IR: Inhibition ratio.