
Figures & data
FIGURE 1 Steps involved in the proposed method.

FIGURE 2 Steps in extraction of contour.
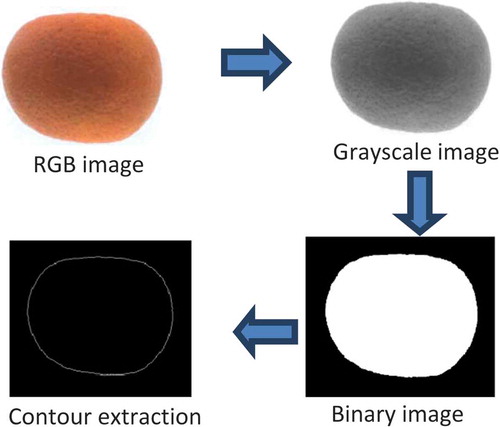
FIGURE 3 Boundary points of apple.
TABLE 1 Criteria for shape models
TABLE 2 Estimated and actual values of volume and mass of apple, sweet-lime, lemon, and orange fruits with % deviation
FIGURE 4(a) Comparison of estimated and actual volume of apples.
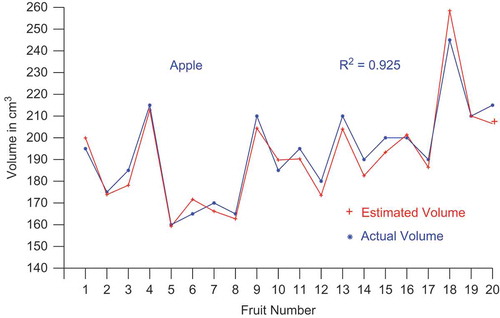
FIGURE 4(b) Comparison of estimated and actual volume of sweet-limes.
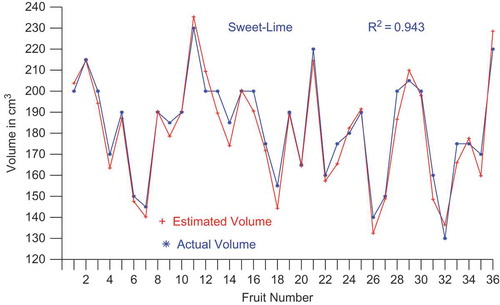
FIGURE 4(c) Comparison of estimated and actual volume of lemons.
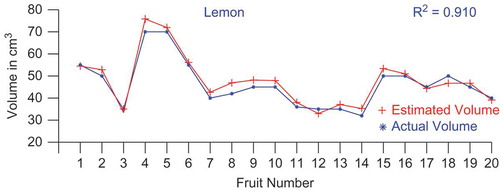
FIGURE 4(d) Comparison of estimated and actual volume of oranges.
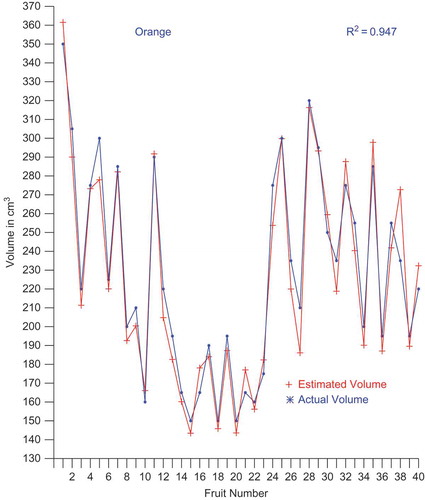
FIGURE 5(a) Comparison of estimated and actual mass of apples.
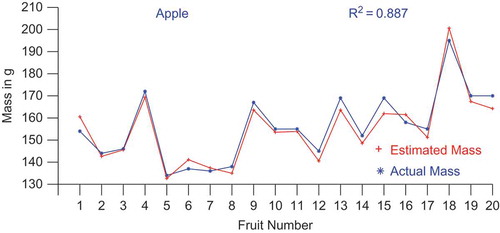
FIGURE 5(b) Comparison of estimated and actual mass of sweet-limes.
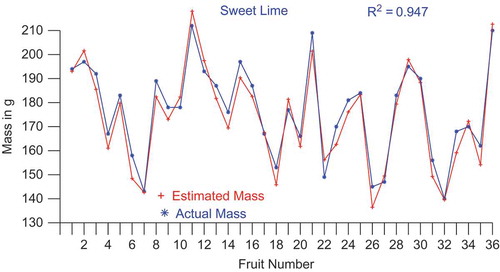
FIGURE 5(c) Comparison of estimated and actual mass of lemons.
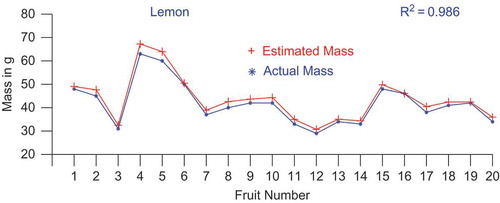
FIGURE 5(d) Comparison of estimated and actual mass of oranges.
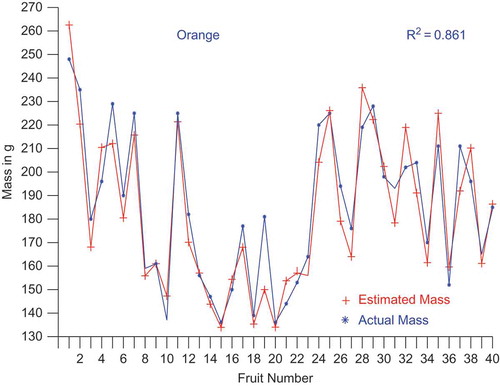
FIGURE 6(a) 2–σ plots for the difference in volume (estimated volume–actual volume) of apples.
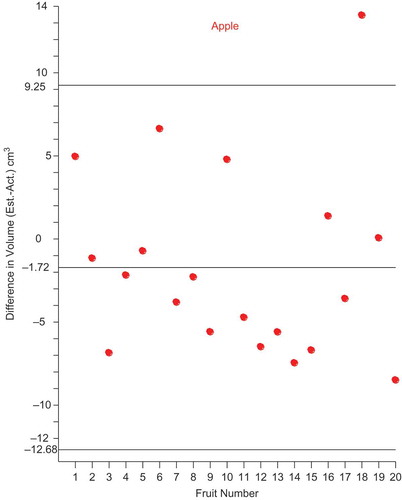
FIGURE 6(b) 2–σ plots for the difference in volume (estimated volume–actual volume) of sweet-limes.
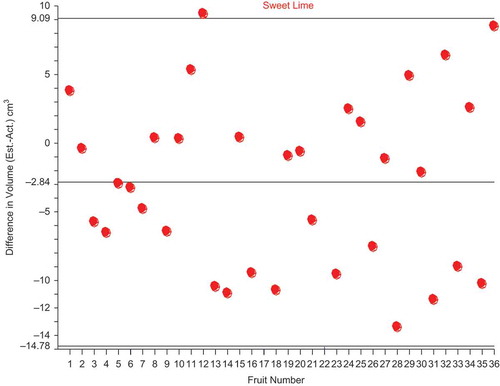
FIGURE 6(c) 2–σ plots for the difference in volume (estimated volume–actual volume) of lemons.
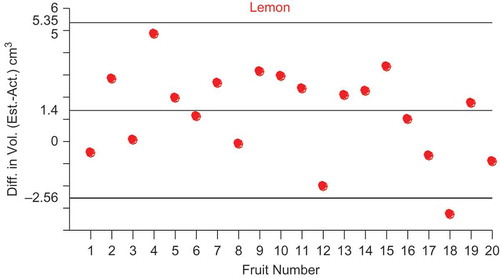
FIGURE 6(d) 2–σ plots for the difference in volume (estimated volume–actual volume) of oranges.
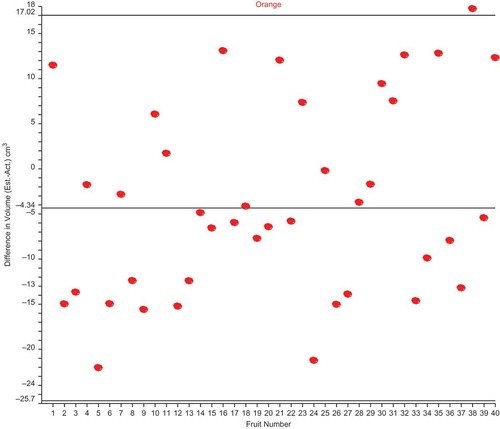
FIGURE 7(a) 2–σ plots for the difference in mass (estimated mass–actual mass) of apples.
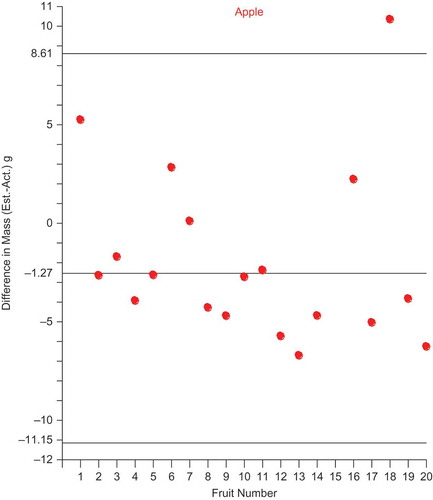
FIGURE 7(b) 2–σ plots for the difference in mass (estimated mass–actual mass) of sweet-limes.
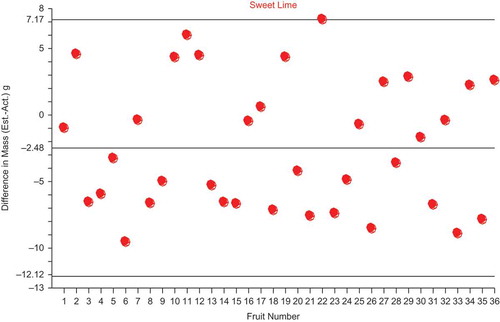
FIGURE 7(c) 2–σ plots for the difference in mass (estimated mass–actual mass) of lemons.

FIGURE 7(d) 2–σ plots for the difference in mass (estimated mass–actual mass) of oranges.
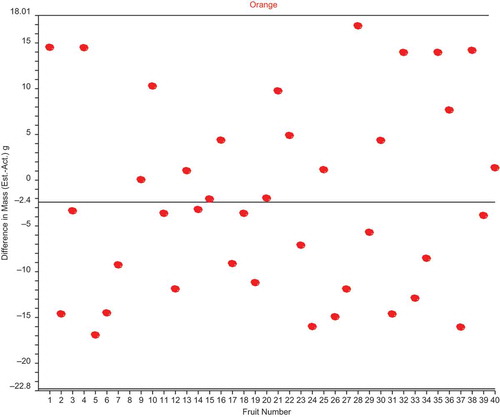
TABLE 3 Correlation data of fruit samples