
Figures & data
TABLE 1 Sensors used and their main applications in PEN 3
FIGURE 1 Soluble solid content (SSC) of persimmon at different picking dates for the daily means of 40 samples and their standard deviations.
FIGURE 2 Ten sensors responses of electronic nose to persimmon fruit aroma.
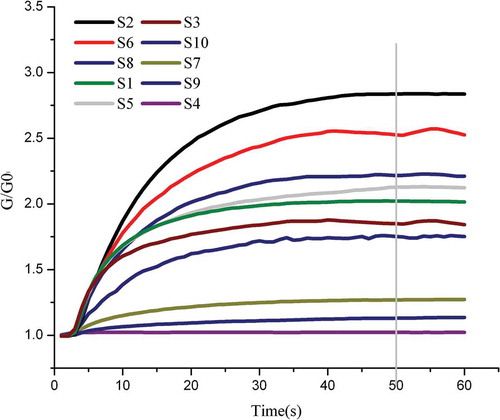
FIGURE 3 PCA analysis for persimmons at different picking date.
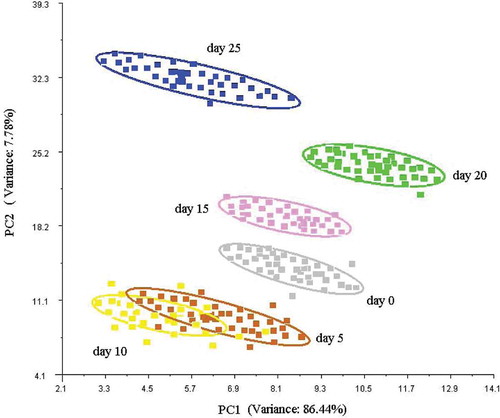
FIGURE 4 Loading analysis related to PC1 and PC2 for persimmons.
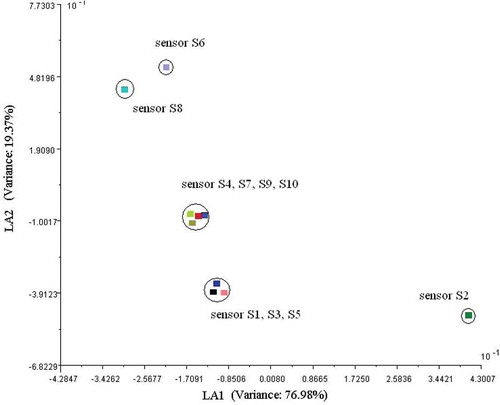
FIGURE 5 Results of (a) various C, where ϵ = 0.1 for ten-fold cross-validation (unit: %); (b) various ϵ, where C = 4 for ten-fold cross-validation (unit: %); and various δ2, where C = 22, ϵ = 2−4 for ten-fold cross-validation (unit: %).
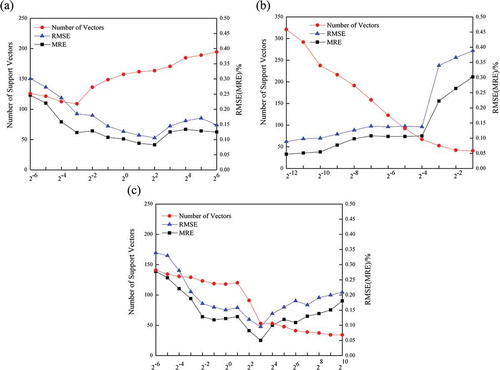
TABLE 2 Comparison of the prediction performance of three models (unit: %)