Figures & data
FIGURE 1 X-ray diffractograms of hydroxyapatite (HA), tilapia bone, EDTA treatment tilapia bone, and HCl treatment tilapia bone.
FIGURE 2 (a) FTIR spectra of hydroxyapatite (HA), tilapia bone (CM), EDTA treatment tilapia bone (EDTA), and HCl treatment tilapia bone (HCl); (b) Fourier transform infrared spectrum of HCl-PSC, EDTA-PSC, EDTA-ASC, and type I collagen; (c) Second derivative of amide I band from FTIR spectra of HCl-PSC, EDTA-PSC, EDTA-ASC, and type I collagen.
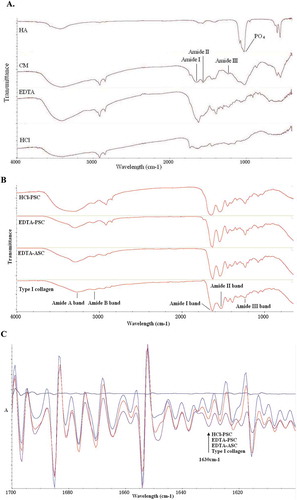
FIGURE 3 (a) TGA curves for EDTA treatment tilapia bone; (b) TGA curves for HCl treatment tilapia bone.
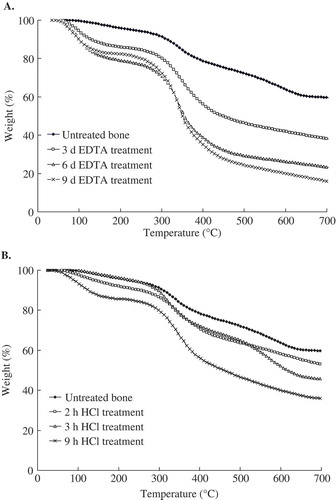
TABLE 1 Mean amino acid compositions for tilapia bone collagen (residues/1000 residues)a
FIGURE 4 (a) SEM micrographs of the surface morphology of the intact and desalted opercular of tilapia. A1: the intact opercular, A2: the opercular desalinated by EDTA, A3: the opercular desalinated by HCl; (b) SEM micrographs of the section morphology of the intact and desalted opercular of tilapia. B1: the intact opercular, B2: the opercular desalinated by EDTA, B3: the opercular desalinated by HCl.
FIGURE 5 The SDS-PAGE pattern of EDTA-ASC, EDTA-PSC, and HCl-PSC. Lane 1: EDTA-ASC; Lane 2: EDTA-PSC; Lane 3: standard protein; Lane 4: type I collagen; Lane 5: residues in acid solution changed at 1.5 h; Lane 6: residues in acid solution changed at 3.0 h; Lane 7: residues in acid solution changed at 4.5 h; Lane 8: HCl-PSC. Molecular weights from top to bottom in the standard protein are 300, 250, 180, 130, 100, and 70 kDa.
FIGURE 6 (a) CD spectra of the EDTA-PSC treated at different temperatures; (b) Temperature effect on the CD spectra at 223 nm of EDTA-PSC; (c) CD spectra of the HCl-PSC treated at different temperatures.