
Figures & data
TABLE 1 The content and range of four nutritional components in 12 peanut varieties
FIGURE 1 Change curve of four different nutritional components in 12 peanut varieties.
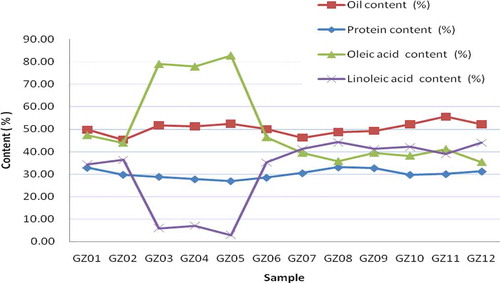
FIGURE 2 Frequency distribution of four different nutritional components in 12 peanut varieties. (A) variable amplitude of protein content was 26.97–33.07%, the class interval was 1.33, and the interval was 6; (B) variable amplitude of oil content was 45.30–55.53%, the class interval was 1.33, and the interval was 10; (C) variable amplitude of oleic oil content was 35.32–82.78%, the class interval was 1.33, and the interval was 47; (D) variable amplitude of linoleic acid content was 2.99–44.19%, the class interval was 1.33, and the interval was 41.
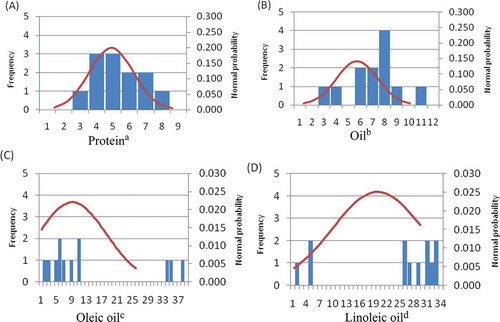
FIGURE 3 Chromatogram and mass spectra of the GZ01 sample using different extraction fibers ((A): PDMS; (B): [PDMS–CAR–DVB]).
![FIGURE 3 Chromatogram and mass spectra of the GZ01 sample using different extraction fibers ((A): PDMS; (B): [PDMS–CAR–DVB]).](/cms/asset/47bf451d-a1f2-43da-8ee4-793ca5359b4f/ljfp_a_1016575_f0003_b.gif)
FIGURE 4 Effect of (A) extraction temperature; and (B) time on the extraction of volatile compounds from the GZ01 sample according to the sum of total peak area.
TABLE 2 Percentage content and mutation analysis of volatile compounds in 12 peanut varieties*
TABLE 3 Pearson correlation coefficient analysis between four nutritional components and 14 volatile compounds