Figures & data
FIGURE 1 PHPLC chromatogram of products with lauric acids as acyl donor. Note: The peak1 was target acylated product, the peak 2, 3 and others were unknown and unrelated by-products.
FIGURE 2 FTIR spectra of C3G and acylated C3G. Note: The line of a was the FTIR spectrum of C3G which was unacylated, the line of b was the FTIR spectrum of acylated C3G.
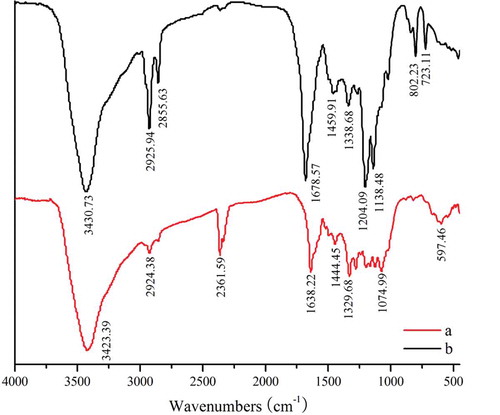
FIGURE 3 Total ion chromatograms of acylated C3G. Note: The liguid chromatogram was the total ion chromatogram of acylated C3G, the peak is what we wanted, called “acylated C3G” which retention time is 6.43.M.
FIGURE 4 Mass spectrogram of acylated C3G. Note: This was the mass spectrogram of acylated C3G, the m/z was 631, m/z + 1 = 632, m/z + 2 = 633.
FIGURE 5 Synthetic route of C3G. Note: This was the synthetic routes of C3G, through the method of mixed ester to combine glucoside’s primary hydroxyl group of C3G and lauric acid, thereby resulting the target product.
FIGURE 6 Comparison of the effects of different temperatures and light times on acylated and unacylated C3Gs.
FIGURE 7 Effect of additive on stability of acylated C3G. A: Vitamin C; B: Sucrose; C: Glucose.