Figures & data
FIGURE 1 Effect of NaCl concentration on solubility of pumpkin protein extracts. Bars with different letters have significantly different mean values (p < 0.05).
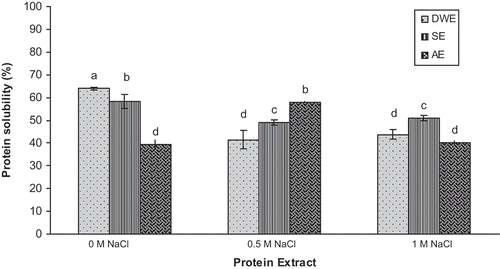
TABLE 1 Effect of ionic strength on the diameter distribution of soluble aggregates by DLS (nm) of the DWES, SES, and the AES of pumpkin protein extracts. When diameter distributions were multimodal, mean size, and proportion of each population were presented
FIGURE 2 Electrophoresis of seed protein extracts (DWES, SES, and AES) at different ionic strenght under A: non-reducing; and B: reducing conditions. Molecular sizes of the protein standards range from 14.4 and 116 kDa. Left lane represents standard weight proteins, lane 1 (DWES at 0 M NaCl), lane 2 (DWES at 0.5 M NaCl), lane 3 (DWES at 1 M NaCl), lane 4 (SES at 0 M NaCl), lane 5 (SES at 0.5 M NaCl), lane 6 (SES at 1 M NaCl), lane 7 (AES at 0 M NaCl), lane 8 (AES at 0.5 M NaCl), and lane 9 (AES at 1 M NaCl).
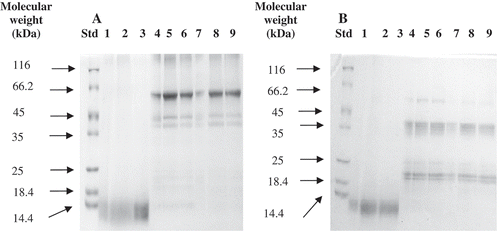
FIGURE 3 Evolution of surface pressure with protein concentration for A: DWES, B: SES, and C: AES at different ionic strength. Bars show standard deviation.
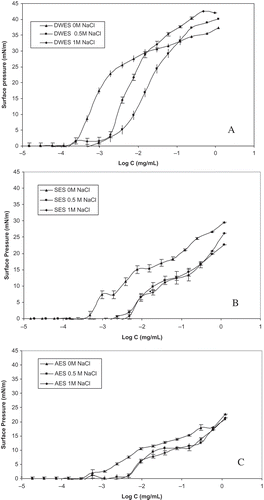
TABLE 2 Evolution of mean diameters and surface coverage of emulsions stabilized by pumpkin seed extract at A: zero time (fresh emulsions); and B: after three day storagea
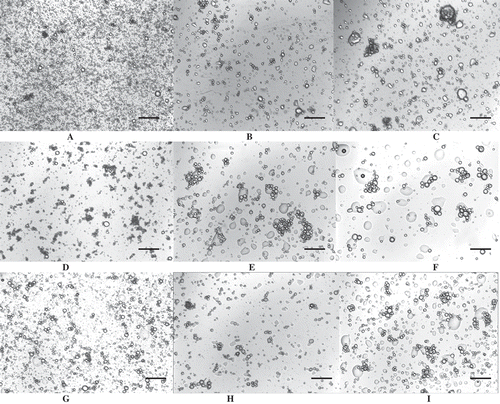
FIGURE 4 Light microscopy images of pumpkin seed extract emulsions after 72 h storage. A: DWES emulsion (0 M NaCl); B: SES emulsion (0 M NaCl); C: AES emulsion (0 M NaCl); D: DWES emulsion (0.5 M NaCl); E: SES emulsion (0.5 M NaCl); F: AES emulsion (0.5 M NaCl); G: DWES emulsion (1 M NaCl); H: SES emulsion (1 M NaCl); I: AES emulsion (1 M NaCl). The black bar represents a size of 150 µm.