
Figures & data
TABLE 1 Relative contents of five anthocyanins and their retention time
FIGURE 1 HPLC profile of Sageretia theezans Brongn fruit.
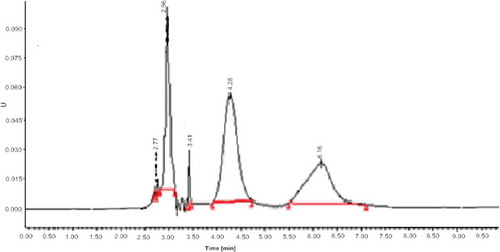
FIGURE 2 MS profile of (A) compound 1; (B) compound 2; (C) compound 3; and (D) compound 4.
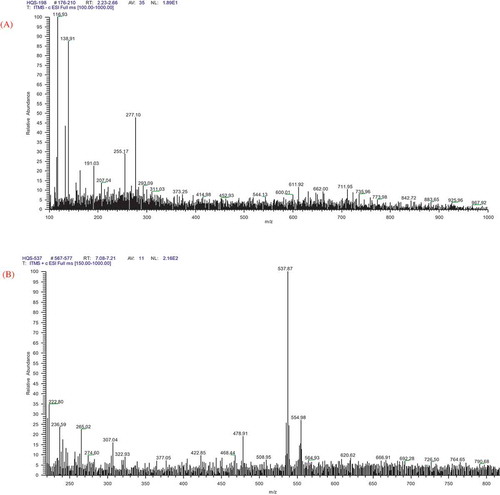
FIGURE 2 Continued.
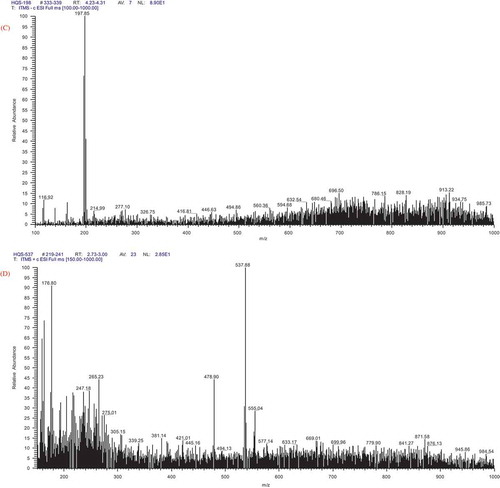
FIGURE 3 (A) Calibration curve of ferrous sulfate standards (0.04, 0.08, 0.12, 0.16, 0.20, 0.24, 0.28, 0.32, 0.36, and 1.00 mmol·L–1), n = 3. Y = 1.2838X + 0.0229 and R2 = 0.9990; (B) FRAP values of different concentrations of the anthocyanins sample and ascorbic acid, n = 3.
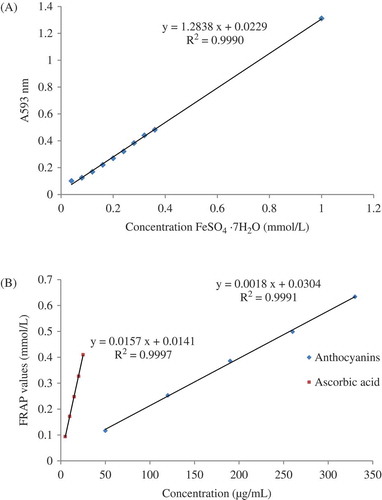
FIGURE 4 The hydroxyl radical scavenging activity of anthocyanins and ascorbic acid, n = 3.
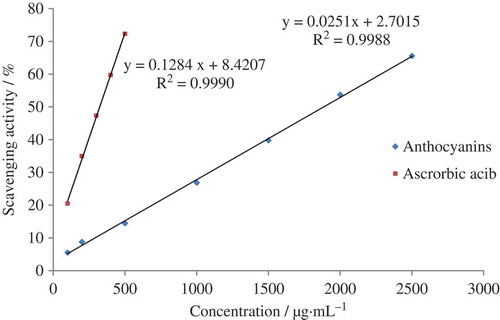
TABLE 2 Superoxide anion radical scavenging activity of anthocyanins at different time, n = 3
TABLE 3 Superoxide anion radical scavenging activity of ascorbic acid at different time, n = 3