Figures & data
TABLE 1 Physico-chemical properties of tray and freeze-dried truffle flours
FIGURE 1 Particle size distribution of tray-dried and freeze-dried truffle flours at 25°C.
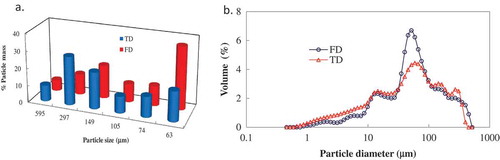
FIGURE 2 DSC thermograms for (a) Tray-dried and freeze-dried truffle flours (flour to water ratio of 1:3) at heating rate of 5 /min and (b) effect of heating rate for freeze-dried sample (F/W = 1:3).
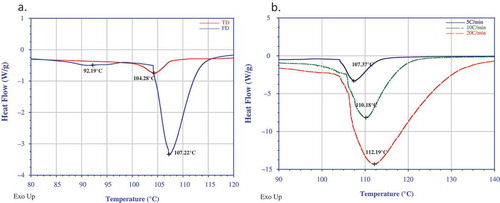
FIGURE 3 Typical mechanical spectra of freeze-dried and tray-dried truffle flour dispersions (flour to water ratio of 1:3) at 40°C.
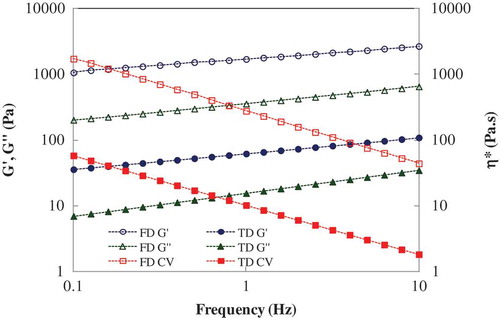
FIGURE 4 Typical non-isothermal heating effect on complex viscosity of freeze-dried truffle flour dough (flour to water = 1:3).
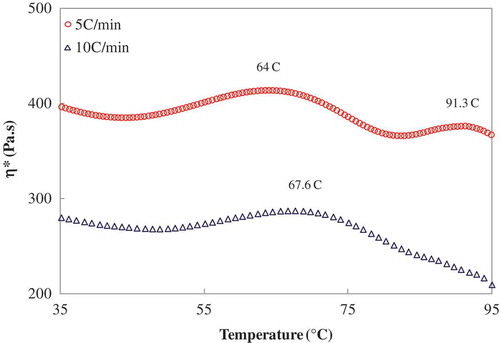
FIGURE 5 Mechanical spectra of truffle flour dispersions (flour to water ratio of 1:3) at selected temperatures (a) Freeze-dried and (b) tray-dried sample.
TABLE 2 Slope of equation (2) of tray and freeze-dried truffle dispersions (flour to water ratio of 1:3) as function of temperature
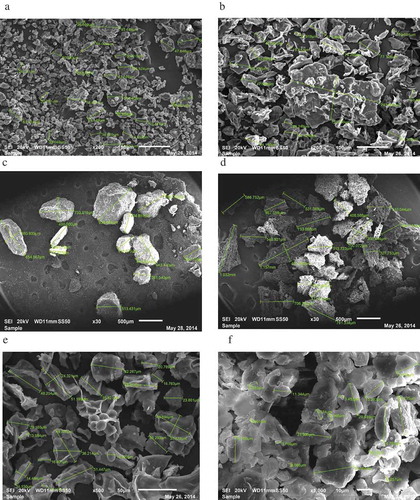
FIGURE 6 Scanning electron microscopy of truffle flours at different magnifications (a) whole TD sample 200×; (b) whole FD sample 200×; (c) 297 mm particle enriched TD sample 30×; (d) 297 mm particle enriched FD sample 30×; (e) 63 mm particle enriched FD sample 500× and (f) 63 mm particle enriched TD sample 1000×.