Figures & data
FIGURE 1 The three varieties of Mexican beans (from left to right): “Flor de mayo,” “Bayo,” and “Negro.”
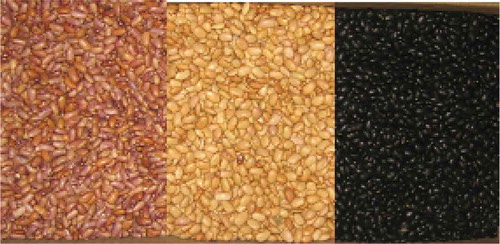
FIGURE 2 A: The designed broad band monopole antenna and B: its reflection coefficient.
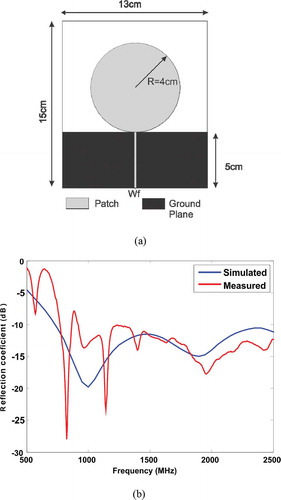
FIGURE 3 Scheme of the dielectric properties measurement system.
TABLE 1 Bulk density of three varieties of beans at different moisture contents
FIGURE 4 Frequency-dependence of dielectric constant (ε’) for three bean varieties at different temperatures: A: “Flor de mayo” (8.8% of moisture content); B: “Bayo” (10.3% of moisture content); and C: “Negro” (9.2% of moisture content).
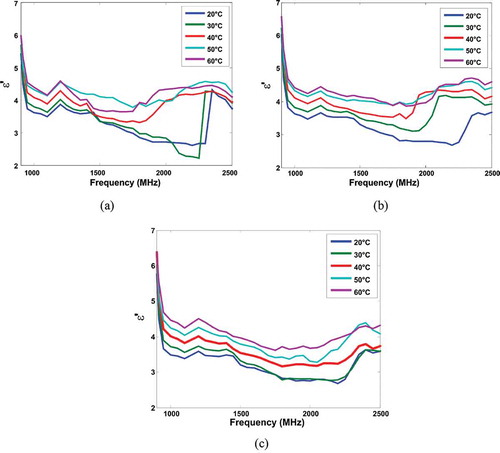
TABLE 2 Loss factor and electrical conductivity of Mexican beans for three varieties with different moisture contents (percentage in wet basis) at different temperatures in the allocated frequencies of 915 and 2450 MHz
FIGURE 5 Temperature-dependence of dielectric constant (ε’) for three bean varieties at different moisture contents: A: “Flor de mayo;” B: “Bayo;” and C: “Negro.”
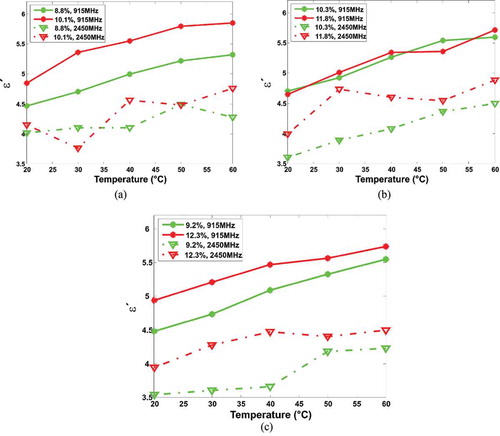
FIGURE 6 Temperature-dependence of loss factor (ε”) for three bean varieties at different moisture contents: A: “Flor de mayo;” B: “Bayo;” and C: “Negro.”
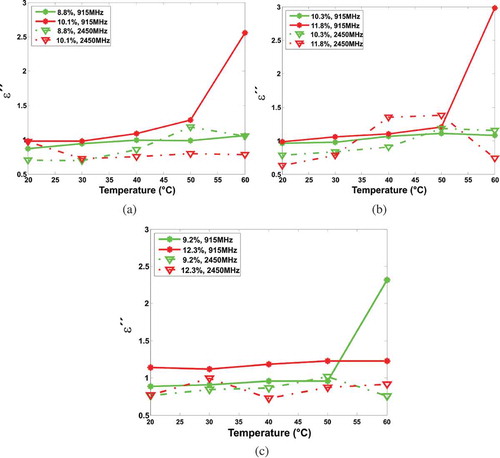
FIGURE 7 The Argand diagram for dielectric properties of three varieties of beans at the allocated frequencies for microwaves.
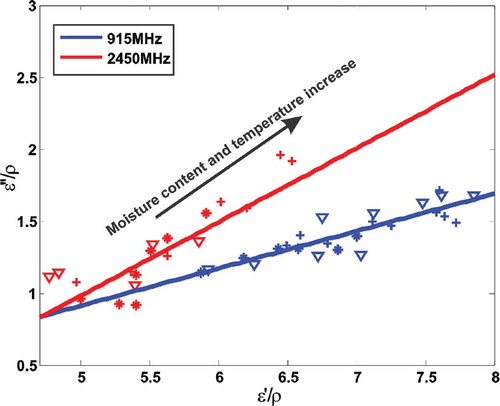
TABLE 3 Average microwave penetration depth (cm) in beans at allocated frequencies, 915 and 2450 MHz, at different temperatures and moisture contents (percentage in wet basis)