Figures & data
TABLE 1 Characteristics of moisture determination methods
TABLE 2 Moisture contents and standard deviations of pearl millet using different air oven procedures
FIGURE 1 Percentage error differences between the 130°C for 1 h. Method versus moisture contents based on 105°C for 72 h.
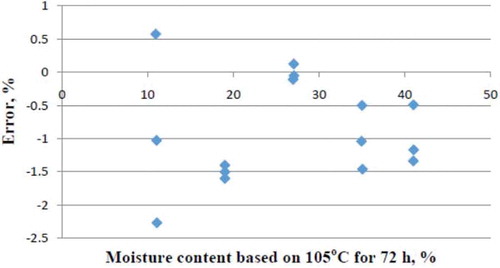
FIGURE 2 Percentage error differences between the 130°C for 2 h. Method versus moisture contents based on 105°C for 72 h.
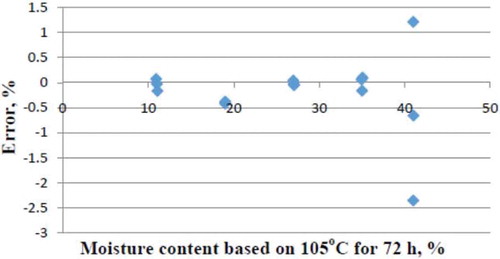
FIGURE 3 Percentage error differences between the 105°C for 5 h. Method versus moisture contents based on 105°C for 72 h.
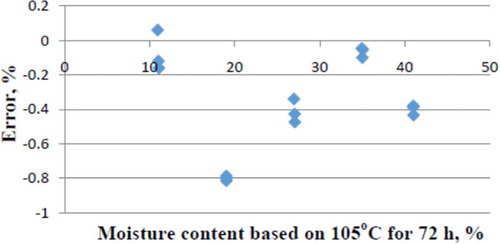
FIGURE 4 Percentage error differences between the 105°C for 48 h. Method versus moisture contents based on 105°C for 72 h.
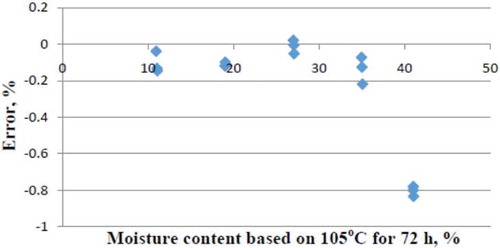
FIGURE 5 Percentage error differences between the 130°C for 16 h. Method versus moisture contents based on 105°C for 72 h.
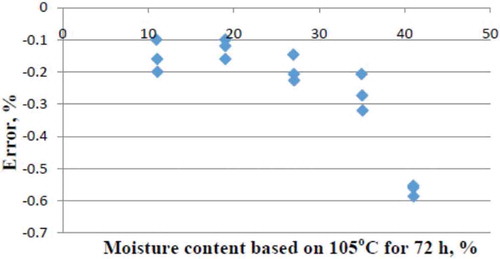
FIGURE 6 Percentage error differences between the 130°C for 20 h. Method versus moisture contents based on 105°C for 72 h.
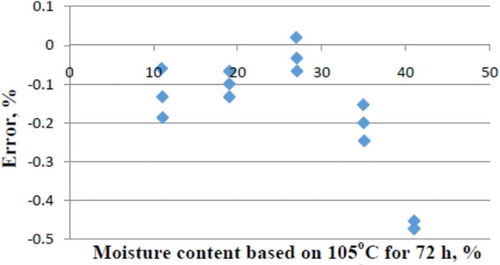
FIGURE 7 Standard deviations based on moisture content determined using 105°C for 72 h (M105t72) and the three methods for ground grain sample: 130°C for 1 h (M130t1), 130°C for 2 h (M130t2), and 105°C for 5 h (M105t5).
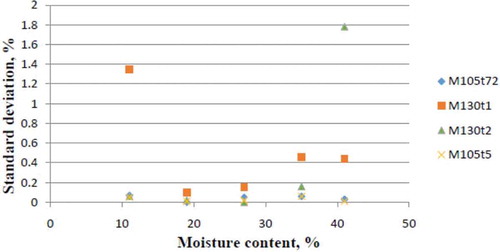
FIGURE 8 Standard deviations based on moisture content determined using 105°C for 72 h (M105t72) and the three methods for whole grain samples: 105°C for 48 h (M105t48), 130°C for 16 h (M130t16), and 130°C for 20 h (M105t20).
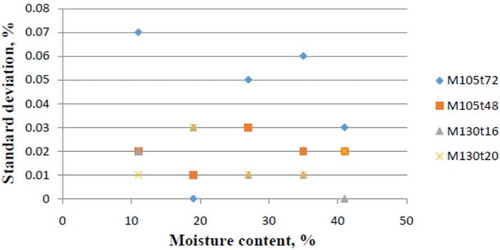
TABLE 3 Regression models for the 105°C for 72 h method as a function of other air oven moisture determination methods
FIGURE 9 Residual plot of the relationship between moisture content based on 130°C for 1 h and 105°C for 72 h.
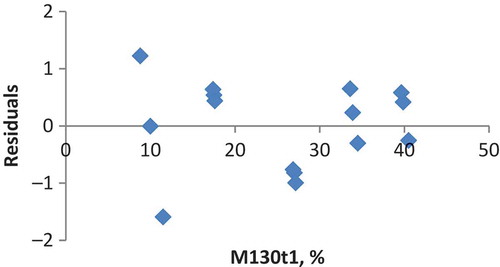
FIGURE 10 Residual plot of the relationship between moisture content based on 130°C for 2 h and 105°C for 72 h.
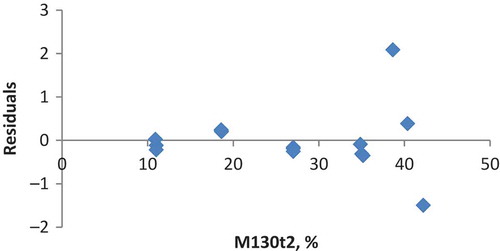
FIGURE 11 Residual plot of the relationship between moisture content based on 105°C for 5 h and 105°C for 72 h.
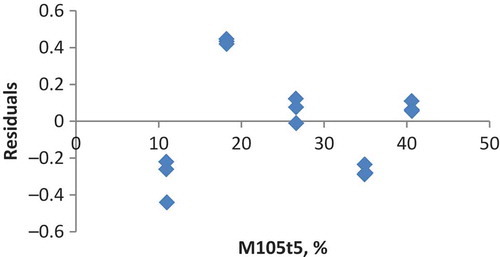
FIGURE 12 Residual plot of the relationship between moisture contents based on 105°C for 48 h and 105°C for 72 h.
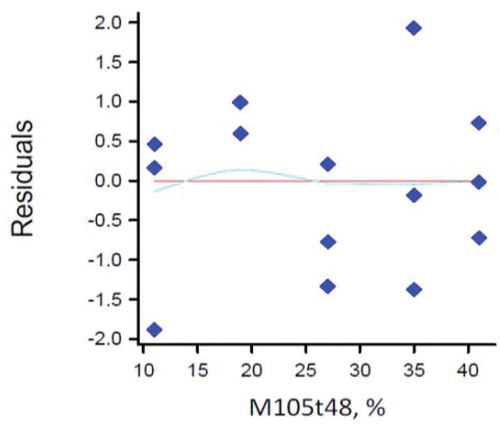
FIGURE 13 Residual plot of the relationship between moisture content based on 130°C for 16 h and 105°C for 72 h.
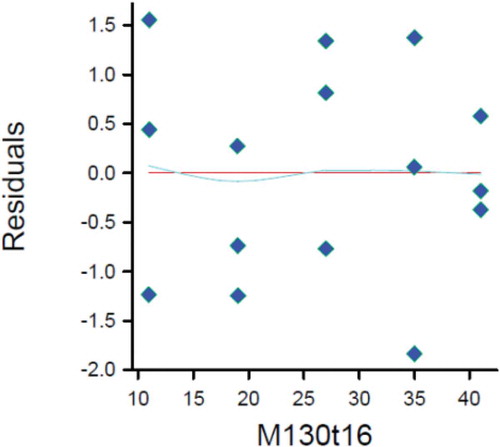
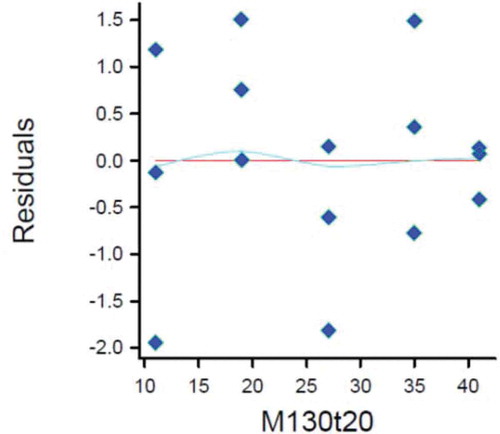
FIGURE 14 Residual plot of the relationship between moisture content based on 130°C for 20 h and 105°C for 72 h.