
Figures & data
FIGURE 1 Samples of 10 varieties including; (1) Agria, (2) Savalan, (3) Florida, (4) Fontaneh, (5) Natasha, (6) Verona, (7) Karso, (8) Elody, (9) Satina, and (10) Emrad.
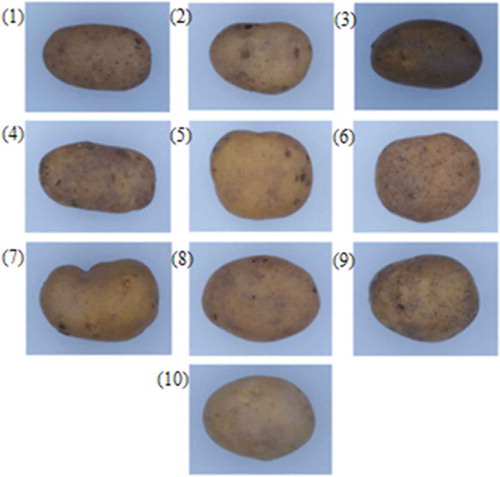
FIGURE 2 Flowchart of the image processing algorithm for classifying potato varieties.
FIGURE 3 Image acquisition system.
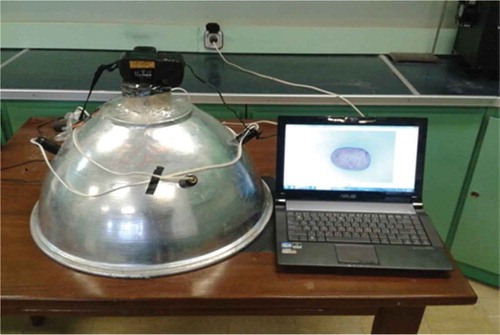
FIGURE 4 Results of pre-processing and segmentation operations; A: original image, B: uniformed background, C: segmented image, and D: boundary of potato.
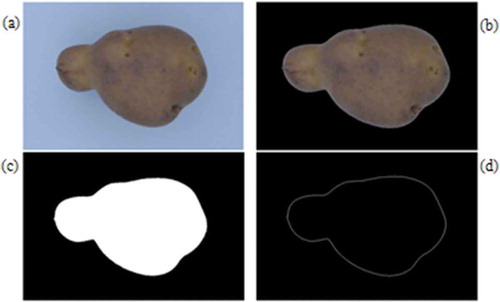
TABLE 1 Extracted color features of potato tubers
TABLE 2 Extracted texture features of potato tubers
FIGURE 5 Length and width of a sample potato extracted from binary image.
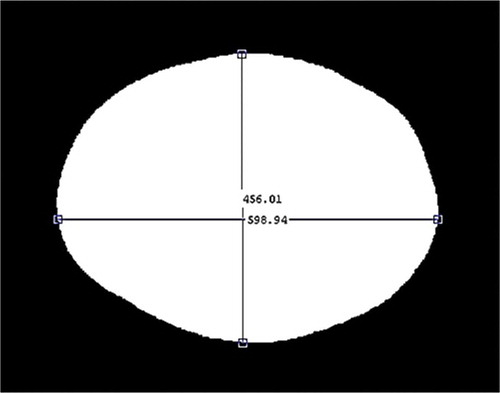
TABLE 3 Extracted morphological features of potato tubers
FIGURE 6 A: External boundary of a potato with its centroid point, B: 1-D corresponding boundary signature.
TABLE 4 The top 16 selected color, textural, and morphological features for recognizing the 10 varieties of potatoes using stepwise discrimination (STEPDIS procedure of SPSS)
FIGURE 7 Topology of ANN for classification system of potato.
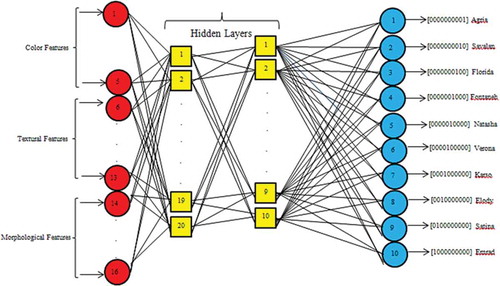
TABLE 5 Summary of texture parameters selection by stepwise PCA analysis
TABLE 6 Values of classification accuracy of DA method when testing
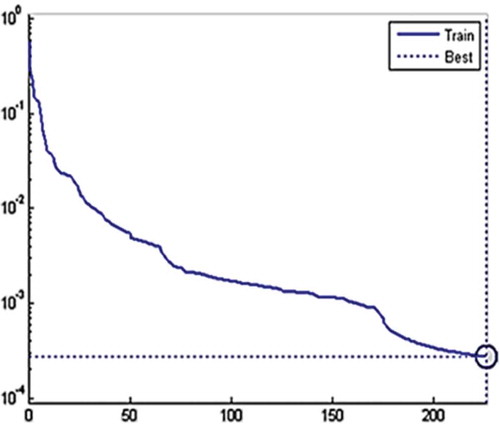
FIGURE 8 Learning curve by Levenberg-Marquardt learning pattern for epoch 226.

Table