
Figures & data
FIGURE 1 Short wave infrared hyperspectral imaging system.
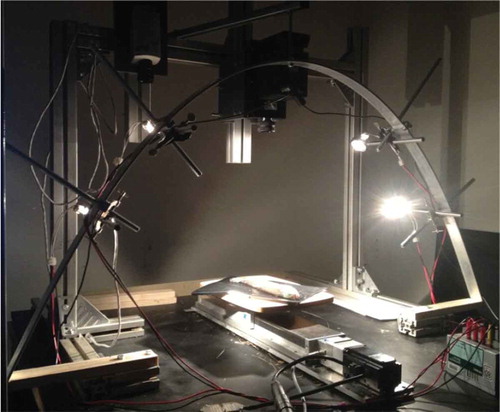
FIGURE 2 (a) Compression test using the universal testing machine and (b) stainless steel probe.
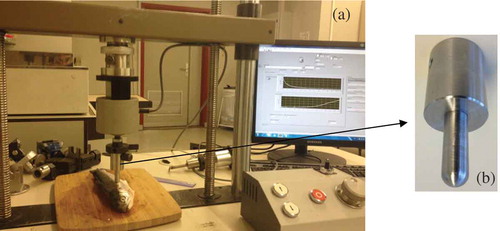
FIGURE 3 Low and high masks of a fish sample. (a) Reflected spectra from fin and fish, (b) images in bands 1100 nm, was used to obtain high mask threshold, (c) image after applying the low mask, (d) image after applying the high mask, (e) image after applying the low and high masks, and (f) final region of interest.
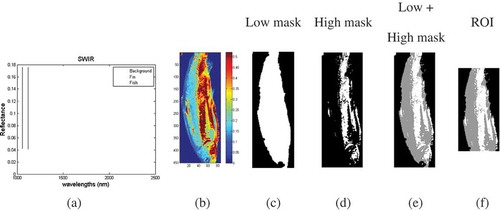
FIGURE 4 Flow chart of the texture analysis of rainbow trout using SWIR hyperspectral imaging.
FIGURE 5 Raw spectra of rainbow trout by SWIR hyperspectral imaging.
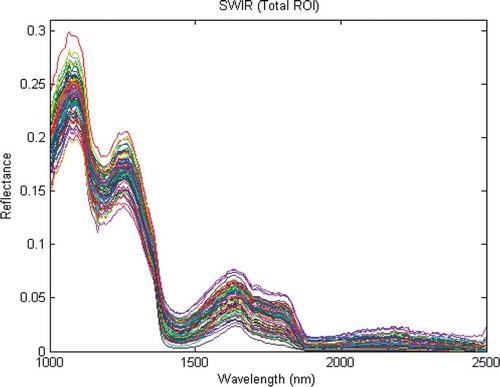
TABLE 1 Mean comparison of maximum force of rainbow trout for four different storage time batches
FIGURE 6 Relative frequency of maximum force obtained from the compression test.
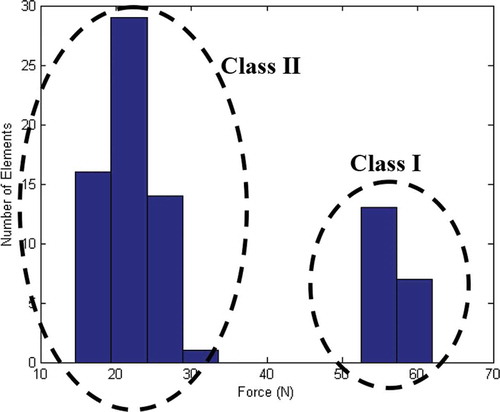
TABLE 2 The obtained results by PLS-DA model