Figures & data
TABLE 1 Physical properties of the cocoa butter (CB), cocoa butter equivalents (F1 and F2), and cocoa butter improver (F3)
TABLE 2 Sensory attributes, scale extremes, and definitions used in descriptive sensory analysis of the chocolate samples by trained panel
TABLE 3 Fatty acid composition of cocoa butter (CB), cocoa butter equivalents (F1 and F2), and cocoa butter improver (F3)
FIGURE 1 (A–C) Thermorheograms of chocolate mass depending on precrystallization temperature and concentration of two CBEs and CBI.
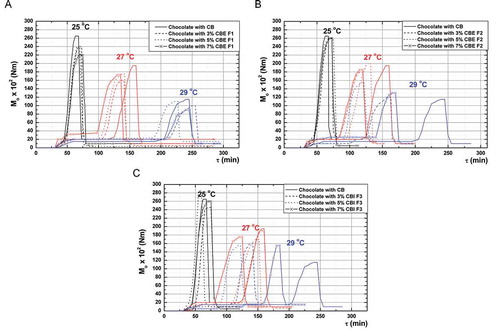
FIGURE 2 (A–C) SFC curves of chocolates depending on precrystallization temperature and concentration of two CBEs and CBI.
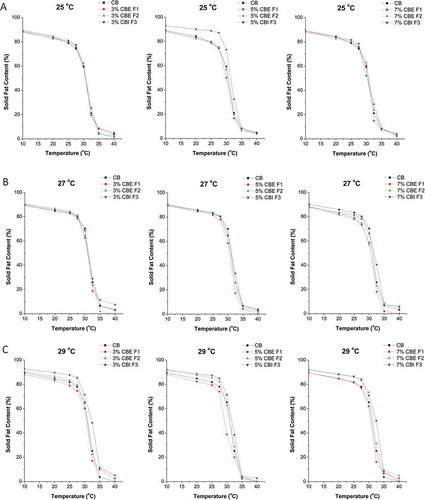
FIGURE 3 (A, B) Overall sensory quality of chocolate samples and influence of main factors on overall sensory quality of chocolate samples.
FIGURE 4 (A, B) PCA score and loading plots of chocolate samples distinction based on the textural properties.
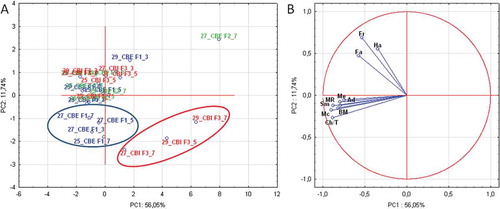
FIGURE 5 Effect of cocoa butter equivalent/improver, precrystallization temperature, and cocoa butter equivalent/improver concentration on hardness of chocolate.