
Figures & data
Figure 1 The absorbance spectra of a virgin olive oil in the MIR spectral region (4000–600 cm–1).
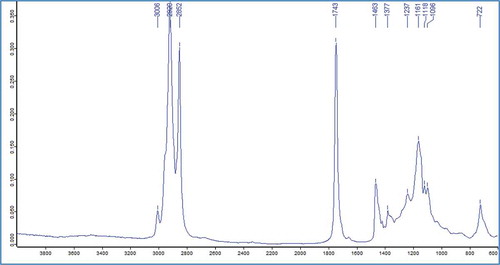
Figure 2 Principal component analysis (PCA) performed on the (first derivative pre-treated) absorbance spectra of all olive oil samples (n = 100). The red filled circles are the two spectral outliers in the olive oil samples. PC-1: principal component-1; PC-2: principal component-2.
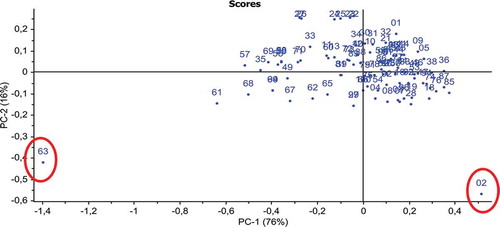
Figure. 3 Plot of the predicted and measured values for total phenolic content, obtained from the final PLS model developed from the MIR spectra.
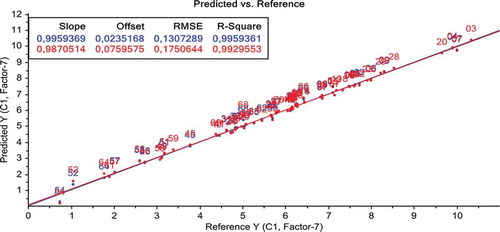
Table 1 Explained variances (%) of PCs used in the PLS model
Table 2 Prediction of total phenolic content of external validation
Table 3 Statistical parameters carried out by external validation on PLS