381
Views
1
CrossRef citations to date
0
Altmetric
Articles

Interactions of Bovine Muscle Tissue with 2450 MHz Microwaves Studied in the Mid-Infrared Region

&
Pages 1353-1361 | Received 22 Mar 2015, Accepted 07 Jul 2015, Published online: 22 Feb 2016

Figures & data

FIGURE 1 The spectrum analysis performed by a Narda SRM 3000 in the range of 2350–2550 MHz of the power density levels related to microwaves generated by a microwave oven Whirlpool Model AVM 541/WP/WH during bovine meat cooking, acquired at 30 cm from the door of the oven.

FIGURE 1 The spectrum analysis performed by a Narda SRM 3000 in the range of 2350–2550 MHz of the power density levels related to microwaves generated by a microwave oven Whirlpool Model AVM 541/WP/WH during bovine meat cooking, acquired at 30 cm from the door of the oven.

FIGURE 2 A: Two representative FTIR spectra in the range 1750–1500 cm–1 from muscle tissue of bovine meat cooked in a conventional electric oven at the temperature of 180°C and in a microwave oven at the power of 600 W, in blue and red colors, respectively. The decrease of the carbonyl band intensity at 1742 cm–1 occurred after microwave oven cooking. Fourier self-deconvolution analysis evidenced a relevant increase in intensity of β-turns content at 1665 cm–1 in Amide I, and a significant increase of β-sheet component at 1695 cm–1 with respect to the α-helix structure, comparing microwave oven and conventional oven cooking spectra; B: Representative spectra in the infrared region from 3000 to 2800 cm−1. The band close to 2960 cm–1 originate from the asymmetric stretching νasCH3 of methyl groups, and the vibration bands at 2921 and 2853 cm–1 are assigned to symmetric and asymmetric bending νsCH2 and νasCH2 of the methylene group, respectively. The intensities of both bands of the methylene group were observed to decrease significantly after microwave oven cooking. The spectrum in red color corresponds to microwave cooking of bovine meat.

FIGURE 2 A: Two representative FTIR spectra in the range 1750–1500 cm–1 from muscle tissue of bovine meat cooked in a conventional electric oven at the temperature of 180°C and in a microwave oven at the power of 600 W, in blue and red colors, respectively. The decrease of the carbonyl band intensity at 1742 cm–1 occurred after microwave oven cooking. Fourier self-deconvolution analysis evidenced a relevant increase in intensity of β-turns content at 1665 cm–1 in Amide I, and a significant increase of β-sheet component at 1695 cm–1 with respect to the α-helix structure, comparing microwave oven and conventional oven cooking spectra; B: Representative spectra in the infrared region from 3000 to 2800 cm−1. The band close to 2960 cm–1 originate from the asymmetric stretching νasCH3 of methyl groups, and the vibration bands at 2921 and 2853 cm–1 are assigned to symmetric and asymmetric bending νsCH2 and νasCH2 of the methylene group, respectively. The intensities of both bands of the methylene group were observed to decrease significantly after microwave oven cooking. The spectrum in red color corresponds to microwave cooking of bovine meat.

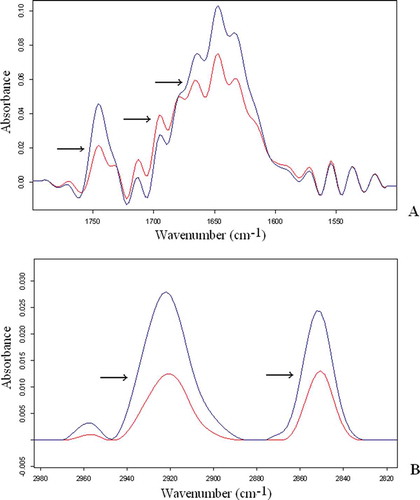
TABLE 1 Average integrated area ratios of bovine meat heated by conventional oven and by microwave oven. Each value reported represents the mean ± SEM of 18 samples

Reprints and Corporate Permissions

Please note: Selecting permissions does not provide access to the full text of the article, please see our help page How do I view content?

To request a reprint or corporate permissions for this article, please click on the relevant link below:

Academic Permissions

Please note: Selecting permissions does not provide access to the full text of the article, please see our help page How do I view content?

Obtain permissions instantly via Rightslink by clicking on the button below:

If you are unable to obtain permissions via Rightslink, please complete and submit this Permissions form. For more information, please visit our Permissions help page.