
Figures & data
FIGURE 1 FTIR spectrum of raw and microwave processed (100-15) peanut samples.
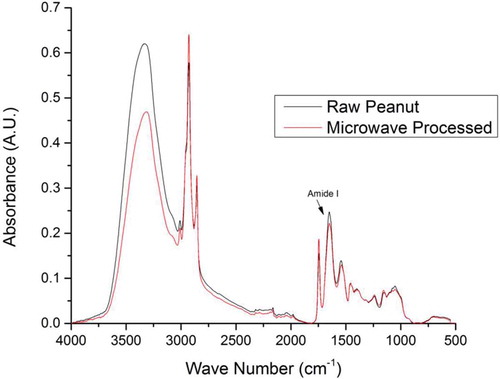
TABLE 1 Notations for representing (a) the hot air roasting of peanut samples (b) the microwave roasting of peanut samples (c) the high electric field processing of peanut samples
TABLE 2 Amide I band frequencies and corresponding protein secondary structure correlations (Adapted from [Carbonaro et al., 2008; Georget & Belton, 2006; Jackson & Mantsch, 1995; Kong & Yu, 2007; Menéndez et al., 1995])
FIGURE 2 Variations in relative areas of the bands fitted to the normalized FTIR spectra of the Amide I region (1700–1600 cm–1) of hot air roasted peanuts.
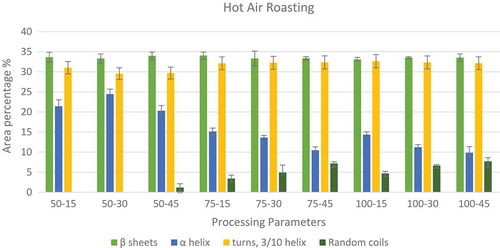
FIGURE 3 Variations in relative areas of the bands fitted to the normalized FTIR spectra of the amide I region (1700–1600 cm–1) of microwave roasted peanuts.
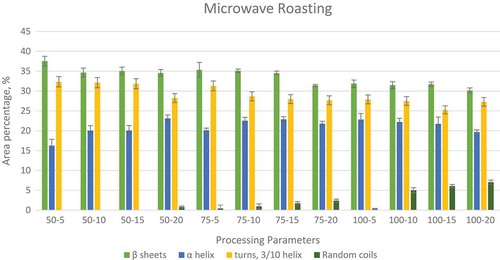
FIGURE 4 Variations in relative areas of the bands fitted to the normalized FTIR spectra of amide I region (1700–1600 cm–1) of high electric field processed peanuts.
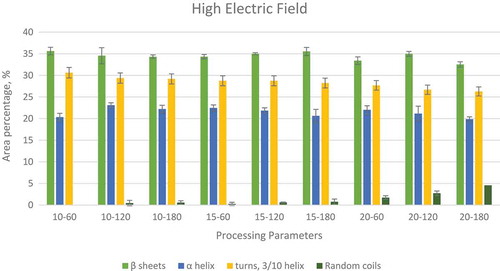
TABLE 3 Effect of hot air roasting on protein digestibility (IVPD%) of peanut protein
TABLE 4 Effect of microwave roasting on protein digestibility (IVPD%) of peanut protein
TABLE 5 Effect of high electric field roasting on protein digestibility (IVPD %) of peanut protein