
Figures & data
FIGURE 1 Light microscopy of the dermis from S. monotuberculatus stained with Van Gieson staining; a: outside edge of dermis; b: inner section of dermis; and c: inside edge of dermis. Scale bar = 50 um.
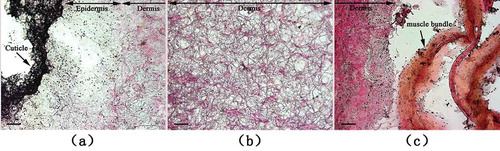
FIGURE 2 SDS-PAGE pattern of CCF and PSC from S. monotuberculatu.
Lane M: protein marker; Lane 1: CCF; Lane 2: PSC.
FIGURE 3 Zymograph for the analyses of autoenzyme activity on PSC.
Lane M, protein marker; lane 1: control (without inhibitor); lane 2: 1,10-phenathroline (10 mM); lane 3: EDTA (10 mM); lane 4: PMSF (1 mM); lane 5: TI (0.1 g/l); lane 6: Benzamidine (10 mM); lane 7: DTNB (10 mM); lane 8: Iodoacetic acid (10 mM); lane 9: E-64 (0.01 mM); lane 10: Leupeptin (0.1 mM); lane 11: Pepstatin A (0.1 mM); Lane M’: protein marker before staining.
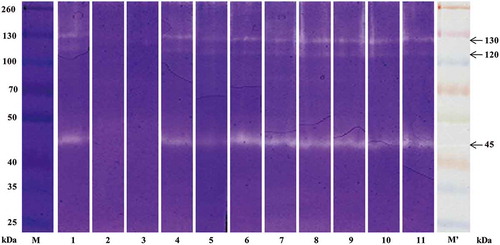
FIGURE 4 SDS-PAGE of PSC digested by autoenzyme.
Lane M, protein marker; lane 1: control (without inhibitor); lane 2: 1,10-phenathroline (10 mM); lane 3: EDTA (10 mM); lane 4: PMSF (1 mM); lane 5: TI (0.1 g/l); lane 6: Benzamidine (10 mM); lane 7: DTNB (10 mM); lane 8: Iodoacetic acid (10 mM); lane 9: E-64 (0.01 mM); lane 10: Leupeptin (0.1 mM); lane 11: Pepstatin A (0.1 mM).
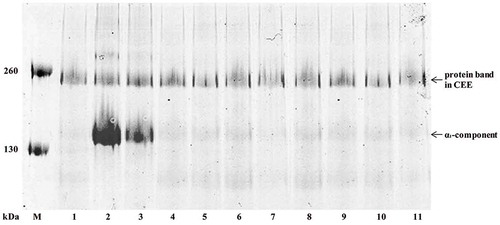
FIGURE 5 SDS-PAGE of CCF digested by autoenzyme.
Lane M, protein marker; Lane 1: PSC; lane 2: CCF; lane 3: crude enzyme extract; lane 4: CCF digested by autoenzyme; lane 5: CCF digested by autoenzyme with addition of 1,10-phenathroline (10 mM).
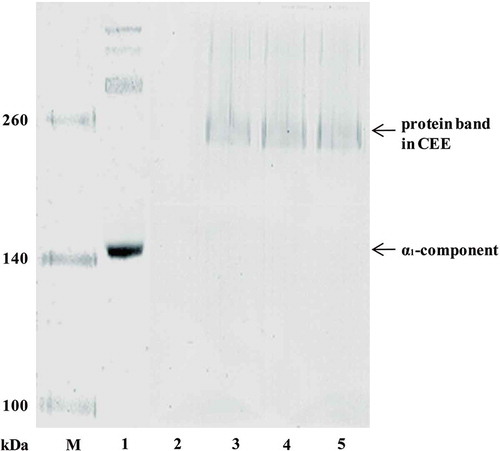
FIGURE 6 Effect of 1,10-phenanthroline on the soluble protein content during autolysis.
Control: absence of 1,10-phenanthroline; 1,10-phenanthroline: presence of 1,10-phenanthroline.
FIGURE 7 Collagenase activity of S. monotuberculatus with different temperatures.
FIGURE 8 Collagenase activity of S. monotuberculatus with different pHs.
TABLE 1 Effect of metal ions on collagenase activity
TABLE 2 Effect of metal ions on activity of EDTA-inhibited collagenase