Figures & data
TABLE 1 Infrared absorption bands of peptide linkages (adapted from [Kong & Yu, 2007; Georget & Belton, 2006])
FIGURE 1 Schematic of the static high electric field treatment system.
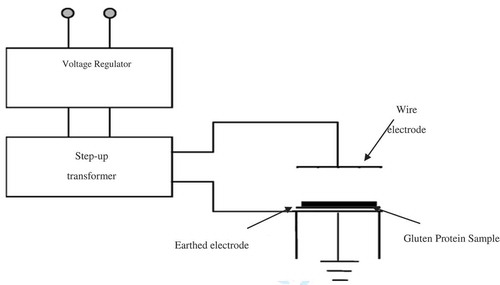
TABLE 2 Amide I band frequencies and assignment to protein secondary structure in H2O media (adapted from [Georget & Belton, 2006; Goormaghtigh et al., 1994; Kong & Yu, 2007; Pelton & McLean, 2000])
FIGURE 2 (a) Typical FTIR spectra of hydrated wheat gluten protein; (b) FTIR spectra of hydrated (H) gluten proteins treated with high electric field intensities (0, 3.5, and 7 kV/cm) for time (30, 60, and 90 min).
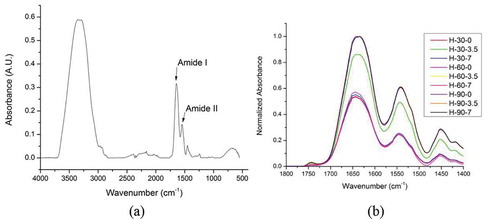
FIGURE 3 (a) Normalized spectra of the amide I region of hydrated gluten protein; (b) Normalized amide I band of hydrated gluten protein subjected to control conditions of 0 kV electric field intensity for 30 min fitted with sums of Gaussian bands; (c) Second derivative of normalized spectra showing the valleys and peaks associated with specific secondary structures for all experimental conditions.
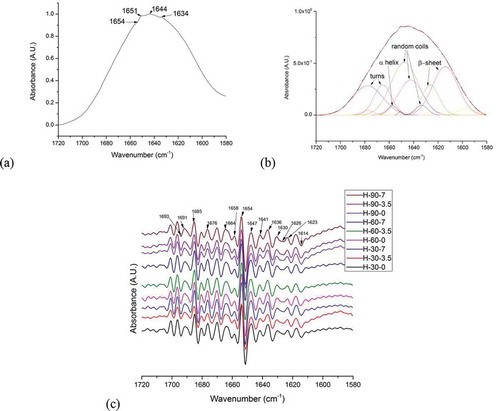
FIGURE 4 Variations in relative areas of the bands fitted to the normalized FTIR spectra of amide I region (1720–1580 cm-1) of gluten protein. Error bars represent standard errors.
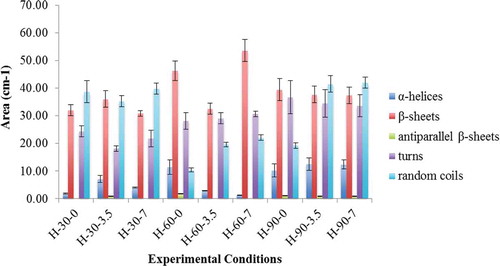
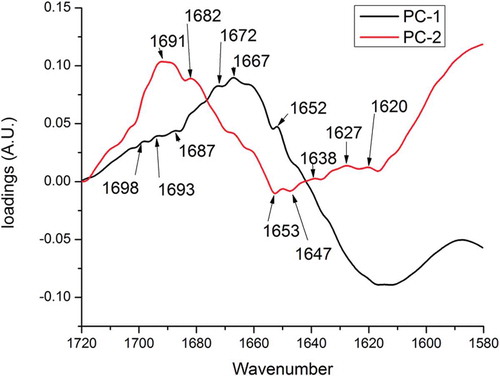
FIGURE 5 PCA loadings plots of the FTIR spectra in the 1720–1580 cm-1 amide I region.