Figures & data
FIGURE 1 Experimental design and analysis of plates. Kirby-Bauer discs were used as a reference point with two sterile paper discs and one standard antibiotic disc. The zone of inhibition of each pathogens were measured by the diameter of the surrounding clear zone around the 6 mm disc in millimeters.
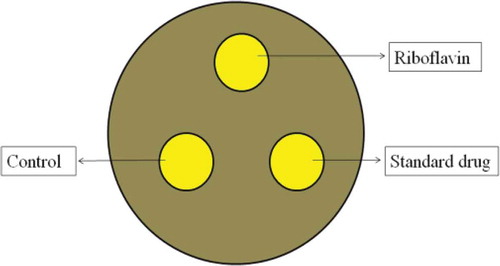
TABLE 1 Average mean zone of inhibitions of selected pathogens
FIGURE 2 Testing the susceptibility of microorganisms to riboflavin solution by using Kirby-Bauer disc diffusion method. The labels refer as following: A-Staphylococcus aureus, B-Enterococcus faecalis, C-Salmonella thyphi, D-Pseudomonas aeruginosa, E-Escherichia coli, F-Klebsiella pneumoniae, and G-Candida albicans, R-Riboflavin, SD-Standard drug, and C-Control.
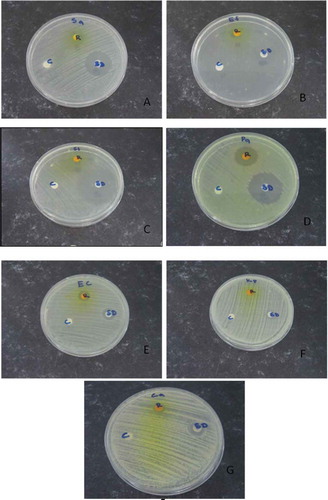
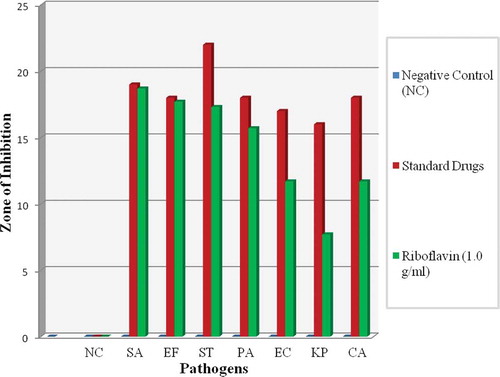
FIGURE 3 Comparison zone of inhibition between gram positive and gram negative bacteria and fungus. SA showed the highest susceptibility toward riboflavin solution compared to other pathogens. All the data were calculated through one way ANOVA and post-hoc multiple comparison tests. The results are expressed as mean ± SD for all pathogens.