
Figures & data
TABLE 1 Solids compositions of honey powder formulations
FIGURE 1 The honey mixture appearance during drying by vacuum oven; A: the formulation of H:M:W 6:4:0; B: the formulation of H:M:W 6:4:10.
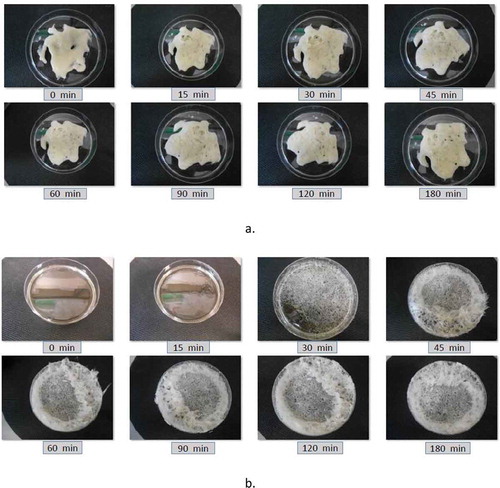
FIGURE 2 Water activity and experimental and GAB calculated water content of honey powder; A: at different total solid content of honey mixture; B: at different DE value of maltodextrin; C: at different maltodextrin ratio.
TABLE 2 The BET and GAB model parameters of honey powder and its corresponding fit parameter
FIGURE 3 Water content and glass transition temperature of vacuum dried honey powder; A: at different total solid content of honey mixture; B: at different DE value of maltodextrin; C: at different maltodextrin ratio.
Table 3 The Gordon-Taylor model parameters based on data of onset, midpoint and endpoint glass transition temperature and the average of Δcp values and standard deviations
TABLE 4 The critical water content and water activity of honey powder based on the onset, midpoint, endpoint glass transition temperature, and monolayer water content and corresponding water activity