Figures & data
FIGURE 1 Diagram of the ultrasonic measuring system.
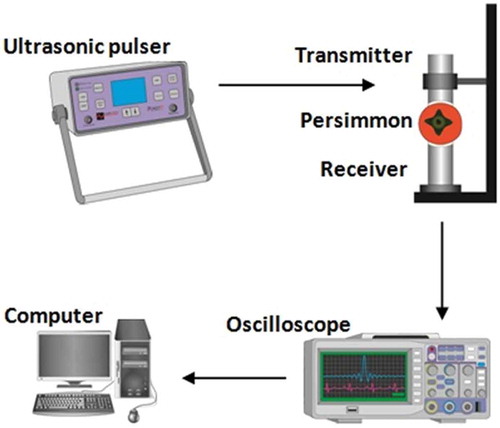
TABLE 1 Morphological properties of the tested persimmon samples
FIGURE 2 Changes of modulus of elasticity and rupture force in “Shomali;” A: and “Karaj;” B: persimmons during storage time. Error bars show one standard deviation from the mean.
FIGURE 3 Changes of ultrasonic velocity and attenuation in “Shomali;” A: and “Karaj;” B: persimmons during storage time. Error bars show one standard deviation from the mean.
FIGURE 4 Correlations between ultrasonic velocity and modulus of elasticity for Shomali (top left) and Karaj (top right) cultivars and between attenuation and modulus of elasticity for Shomali (bottom left) and Karaj (bottom right) cultivars. The solid line is the regression line.
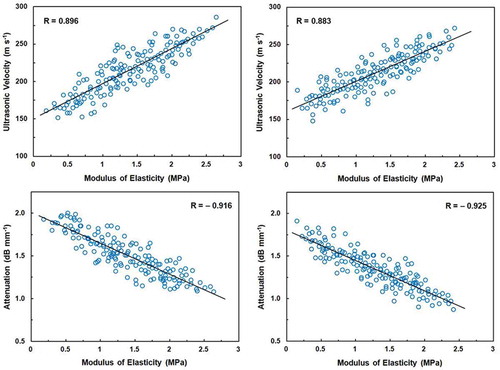
FIGURE 5 Correlations between ultrasonic velocity and rupture force for Shomali (top left) and Karaj (top right) cultivars and between attenuation and rupture force for Shomali (bottom left) and Karaj (bottom right) cultivars. The solid line is the regression line.
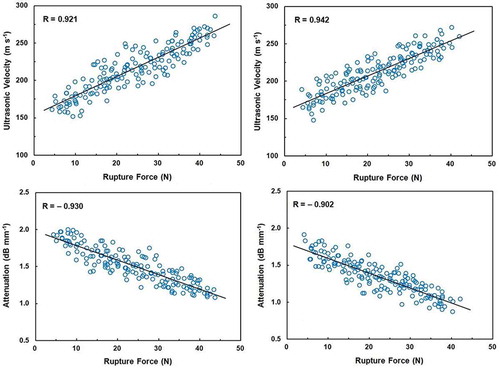
TABLE 2 Regression equations for predicting the mechanical and chemical properties of persimmon fruits from ultrasonic velocity and attenuation
FIGURE 6 Scatter plots of measured versus predicted values of mechanical properties obtained by linear model: modulus of elasticity of Shomali (top left) and Karaj (top right) cultivars; rupture force of Shomali (bottom left) and Karaj (bottom right) cultivars. The diagonal black line represents the perfect prediction line.
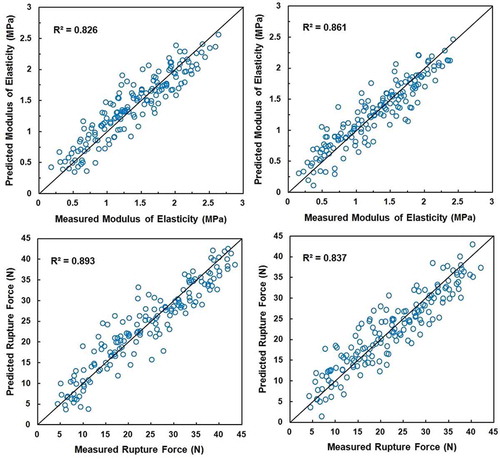
FIGURE 7 Changes in soluble solids content in persimmons during storage time. Error bars show one standard deviation from the mean.