
Figures & data
FIGURE 1 Basic Pangasius sp. anatomy. Note: Scale = 5 cm.
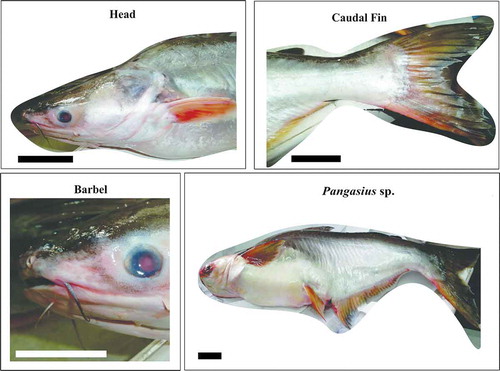
TABLE 1 Biometric and water quality information related to farmed and wild-caught Pangasius sp.
TABLE 2 Analysis of certified reference materials
TABLE 3 Metal concentrations in freeze-dried Pangasius sp.
TABLE 4 Detailed discrimination results from LDA model
FIGURE 2 PC2 versus PC1 score-loading biplot and dendrogram for training set (84 × 12). The letters W and A donate to wild-caught and farmed Pangasius sp.
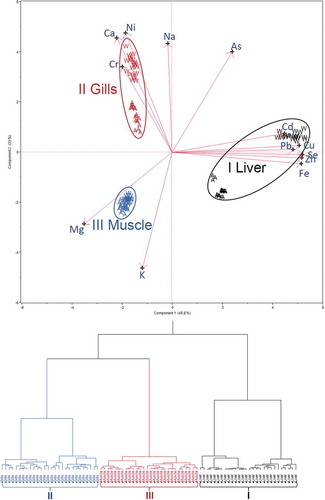
FIGURE 3 Biplots and dendrograms using subset comprising entirely: A: liver; B: gills; C: muscle samples. The letters W and A donate to wild-caught and farmed Pangasius sp.
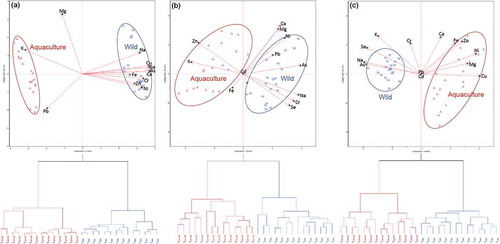
TABLE 5 Comparison of metal concentrations in Pangasius sp. on weight wet basis
TABLE 6 The HQ values associated with consumption of Pangasius sp.