Figures & data
FIGURE 1 Gel chromatography of the purification of rapeseed protein hydrolysates by the Sephacryl S-100HR column.
FIGURE 2 The antioxidant activity of the groups of RPHs; A: ORAC values of the groups of RPHs; B: PSC values of the groups of RPHs; C: Cytotoxic effects of the groups of RPHs by using MTT dye; D: CAA values of the groups of RPHs. Note: Histograms marked with different letters are significant at p < 0.05.
FIGURE 3 Cellular antioxidant capacity EC50 values. Note: Histograms marked with different letters are significant at p < 0.05.
TABLE 1 Amino acid compositions of group 3
FIGURE 4 The antioxidant activity of the groups separated by RP–HPLC; A: ORAC values of each group separated by RP–HPLC; B: PSC values of each group separated by RP–HPLC.
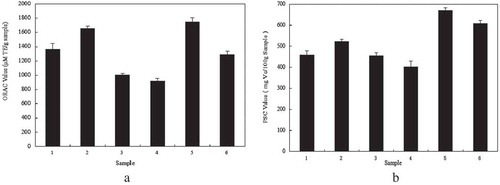
FIGURE 5 Separation of fraction 5 on RP–HPLC.
FIGURE 6 MS1 spectrum of group 5.
FIGURE 7 A: ESI–MS/MS spectrum of group 5 (m/z < 200); B: ESI–MS/MS spectrum of group 5 (m/z > 200).