
Figures & data
TABLE 1 Compositional design of the mixtures
TABLE 2 Mathematical models used to correlate viscosity data
FIGURE 1 Relationship between shear stress and shear rate for the buriti oil at various temperatures.
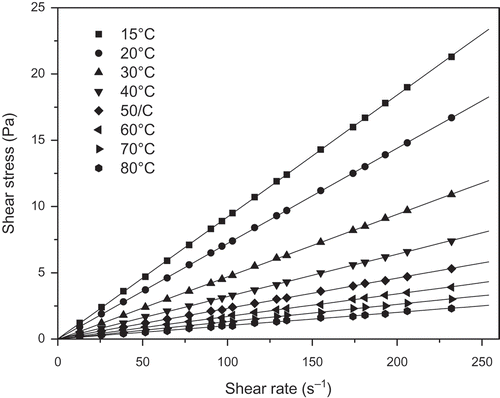
FIGURE 2 Relationship between shear stress and shear rate for the pataua oil at various temperatures.
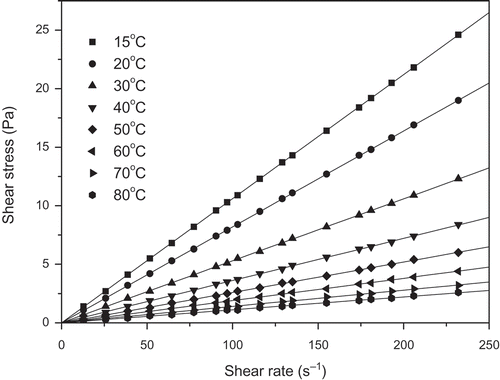
FIGURE 3 Relationship between shear stress and shear rate for the Brazil nut oil at various temperatures.
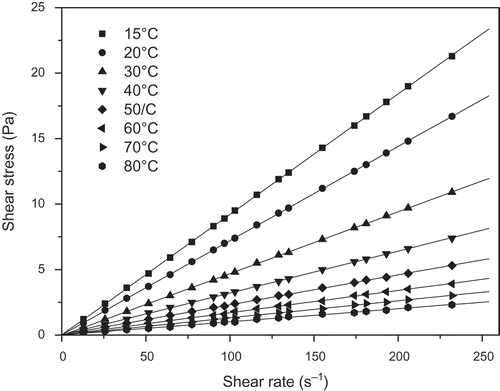
TABLE 3 Viscositiesa (mPa.s) of vegetable oils at different temperatures
TABLE 4 Values of constants A (a(mPa.s) ×106) and B obtained from the five models applied to the various samples of vegetable oils
TABLE 5 Viscosity values (mPa.s) of the mixtures predicted by Equations 6 and 7 and statistical parameters
TABLE 6 FA composition (percentage by weight of total FA) of the vegetable oil samples
TABLE 7 Values of constants (Eq. 9) that can be used to predict vegetable oil viscosity based on either monounsaturated or polyunsaturated FA