Figures & data
FIGURE 1 Effect of heating temperature and time on the protein aggregation in milk serum. The typical elution profiles from 40 to 140 min were used for observation. The heated milk was simplified as temperature/time. Raw milk (RM) in all groups was for comparison. mAU: milli-absorbance units. Upward arrow points to the whey proteins, and downward arrow points to the protein aggregates.
FIGURE 2 SDS-PAGE analysis of the SEC fractions from (A) RM, and from (B) the heated milk. Lane 1, the standard proteins (kDa). Lanes 2–7 were from 53–56, 65–68, 77–80, 85–88, 105–108, and 113–116 min of SEC elution, respectively.
FIGURE 3 The typical profiles of multimodal size distribution of whey proteins and milk protein aggregates in milk serum.
TABLE 1 Effects of heat treatment on the textural variables in the undisturbed gel
TABLE 2 Effects of heat treatment on the textural variables in the stirred gel
FIGURE 4 Biplot of PCA (PC1 and PC2) from the textural variables for the undisturbed gels.
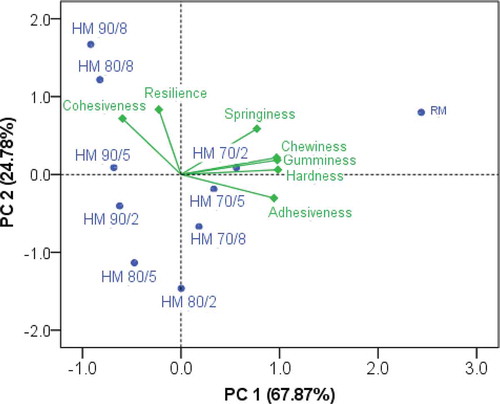
FIGURE 5 Plots of PCA from the textural variables for the stirred gels. (A) Conversion of the textural variables to the principle component; (B) Differences among the heat treatments identified by the principle component.
FIGURE 6 Effect of heating temperature and time on WHC and CCY of rennet gel.
FIGURE 7 Effect of heat treatment (70, 80, and 90ºC for 5 min) on the microstructure of rennet gels from heated milk. The heated milk was simplified as temperature/time.