Figures & data
TABLE 1 Scheme of elution gradient for HPLC-DAD analysis of amino acids
TABLE 2 Metabolites of pickled wax gourd by the 1-D 400 MHz 1H-NMR spectra
FIGURE 1 A typical HPLC-DAD chromatogram of different monosaccharide standards.
FIGURE 2 HPLC chromatogram of soluble sugars in different fermentation periods of pickled wax gourd (A–E: pickled for 0, 5, 10, 15, and 20 days, respectively).
FIGURE 3 HPLC chromatogram of amino acids in different fermentation periods of pickled wax gourd (A–E: pickled for 0, 5, 10, 15, and 20 days, respectively).
FIGURE 4 Spectrum of metabolites of pickled for 0 day and 20th day wax gourd (1: L-rhamnose; 2: Glutamate; 3: Methionine; 4: N-acetylglutamate; 5: Succinate; 6: γ-aminobutyrate; 7: Aspartate; 8: Choline-O-sulfate; 9: Phosphorylcholine; 10: Choline; 11: Betaine; 12: D-galactose; 13: Mannose; 14: Tryptophan; 15: Mannitol; 16: Ornithine; 17: Arabinose; 18: Lysine; 19: α-Glucose; 20: Glycine; 21: Threonine; 22: Arginine; 23: Xylose; 24: Ascorbic acid; 25: Citric acid; 26: Succinic acid; 27: Aspartic acid; 28: Lactate; 29: Isoleucine; 30: Valine; 31: Lactose; 32: β-Glucose).
FIGURE 5 PCA plots of 1HNMR spectra from pickled wax gourd at 0, 5, 10, 15, and 20 day fermentation.
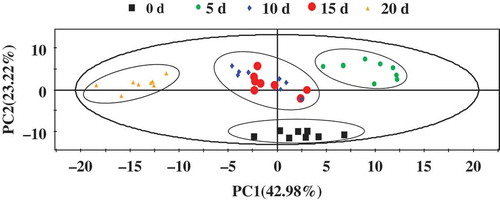
FIGURE 6 OPLS-DA plots of 1H-NMR spectra from adjacent pickled days (A), (C), and (E) and corresponding coefficient plots (B), (D), and (F). The significantly different metabolites between the adjacent pickled days were indicated with color. Key: (1) L-rhamnose; (2) Lactate; (3) Fatty acids; (4) Arginine; (5) N-acetylglutamate; (6) Succinate; (7) Phosphorylcholine; (8) Methionine; (9) Ornithine; (10) Lysine; (11) β-Glucose; (12) Glycine; (13) Choline; (14) Proline; (15) Acetate; (16) Mannitol; (17) α-Ketoglutaric acid.
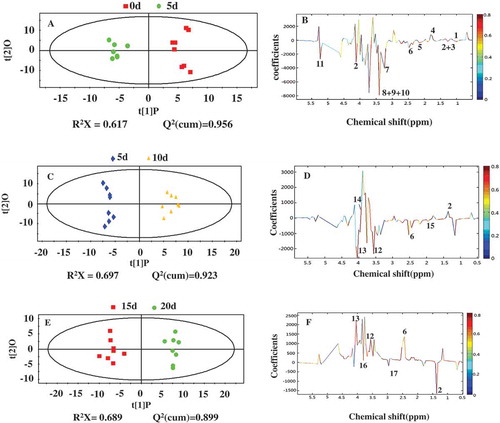
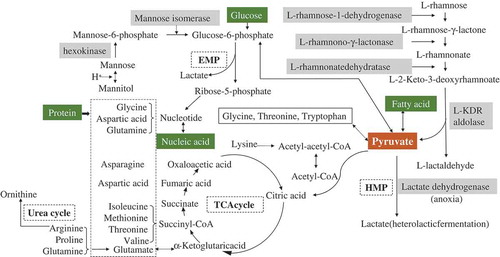
FIGURE 7 The major metabolites by a complex bacterial community in pickled wax gourd.