Figures & data
Table 1. The mixture used for examining anti-oxidative treatments.
Table 2. Independent variables and their coded and actual values used for optimization.
Figure 1. Sample of 1% agarose electrophoresis of large-subunit genes of enzyme Rubisco.
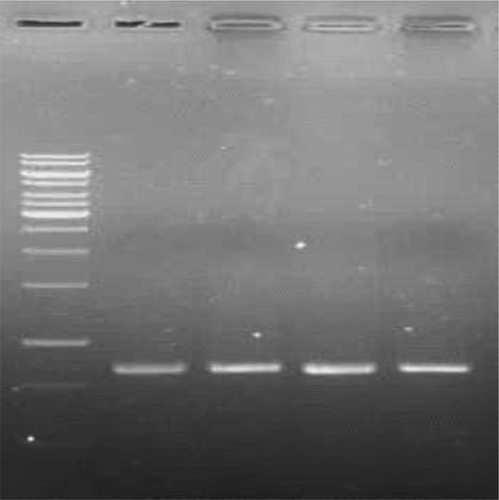
Figure 2. Change in peroxide value after 4 weeks of storage at 60°C in treated samples.
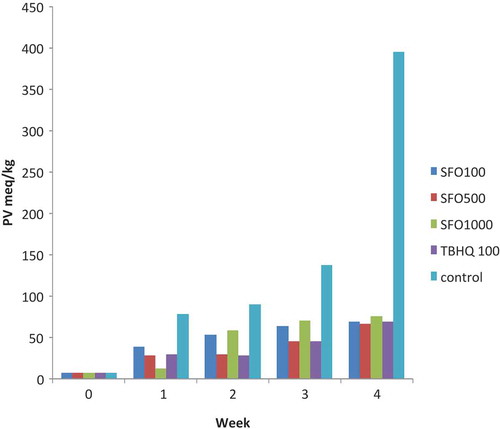
Figure 3. Changes in para-anisidine value after 4 weeks of storage at 60°C in treated samples.
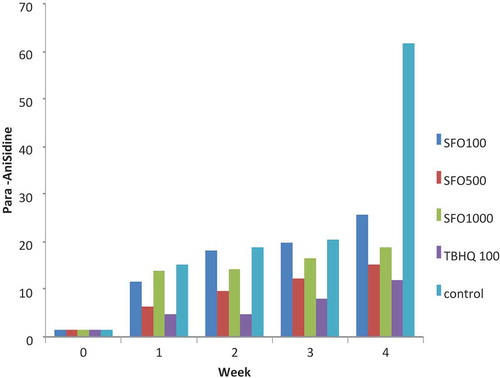
Figure 4. Changes in rancimat over 4 weeks of storage in the treatments under study.
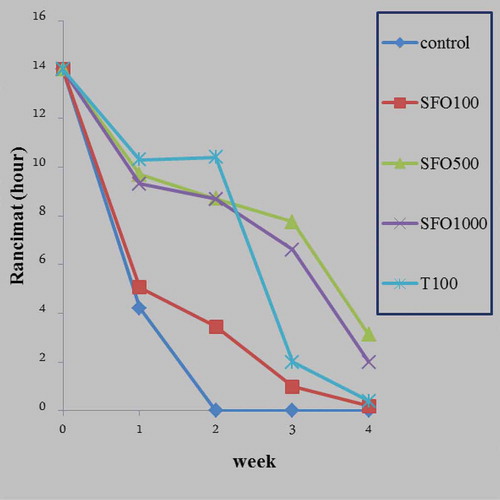
Table 3. Central composite design with experimental and predicted values for peroxide, anisidine, and racimat value.
Table 4. Results of ANOVA and sunflower oil modeling containing antioxidant in peroxide, anisidine, and rancimat value.
Table 5. Optimization results of TBHQ100.
Table 6. Optimization Results of SFO-500.
Figure 5a. Response surface plotting of the effect of temperature and time on change of para-anasidine during frying after adding antioxidant (SFO 500 ppm).
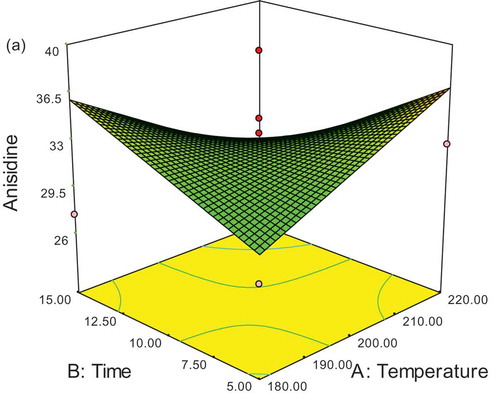
Figure 5b. Response surface plotting of the effect of temperature and time on change of peroxide value during frying after adding antioxidant (SFO 500 ppm).
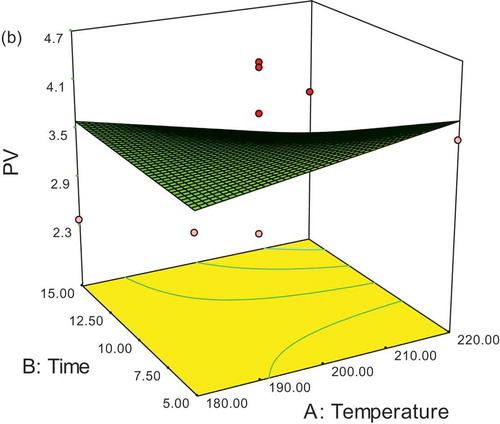
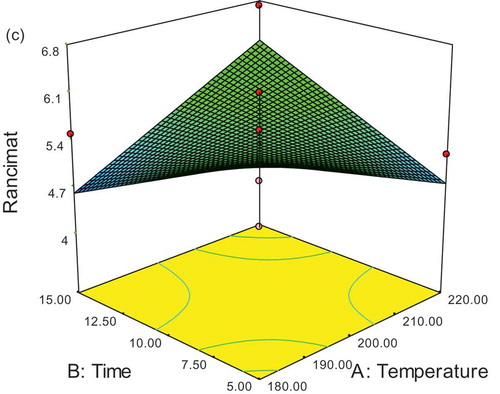
Figure 5c. Response surface plotting of the effect of temperature and time on change of Rancimat during frying after adding antioxidant (SFO 500 ppm).