
Figures & data
FIGURE 1 The cutting machine and knives.
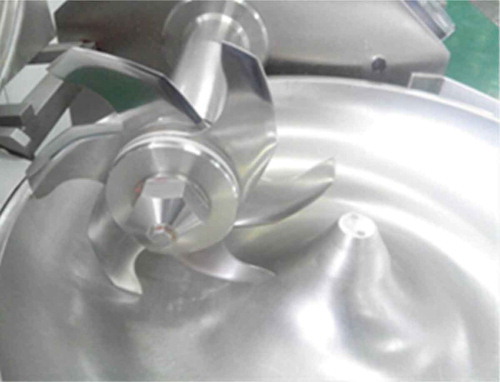
FIGURE 2 The beating machine showing blunt paddles.
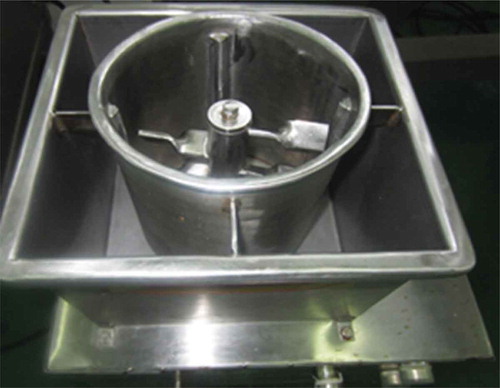
TABLE 1 Color (L*, a*, and b* values) of raw and cooked meat batter preparations by chopping or beating with various amounts of added salt
FIGURE 3 Cooking loss (%) of raw batters when produced by chopping or beating with various amounts of added salt.
TABLE 2 Texture profile analysis of cooked meat batters preparations by chopping or beating process with various amounts of added salt
FIGURE 4 Changes in dynamic storage modulus (G’, Pa) with increasing temperature (T, °C) for different meat formulations. C: chopping with 2% salt; T1: beating with 1% salt; T2: beating with 2% salt.
FIGURE 5 Scanning electron micrographs of cooked meat batters. C: chopping with 2% salt; T1: beating with 1% salt; T2: beating with 2% salt.
TABLE 3 Effect on relaxation time (ms) and peak ration (%) of raw meat batters preparations by chopping or beating process with various amounts of added salt
TABLE 4 Effect on relaxation time (ms) and peak ration (%) of cooked meat batters preparations by chopping or beating process with various amounts of added salt