
Figures & data
FIGURE 1 A: Lighting chamber for image capturing; B: shrimp side pictures; and C: shrimp top pictures.
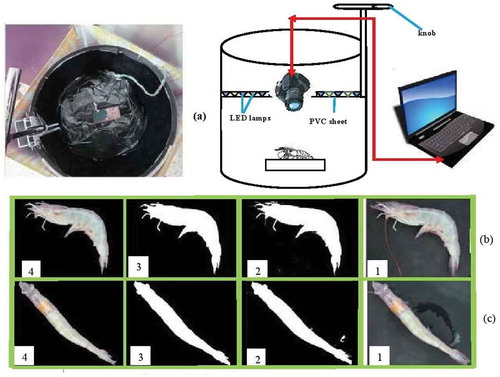
TABLE 1 The variables extracted from the images captured
TABLE 2 Statistics of the variables
TABLE 3a General fisher weights
TABLE 3b Fisher weights for categories 1 and 2
TABLE 3c Fisher weights for categories 1 and 3
TABLE 3d Fisher weights for categories 1 and 4
TABLE 3e Fisher weights for categories 2 and 3
TABLE 3f Fisher weights for categories 2 and 4
TABLE 3g Fisher weights for categories 3 and 4
FIGURE 2 Cultured shrimp color changes during storage on ice.
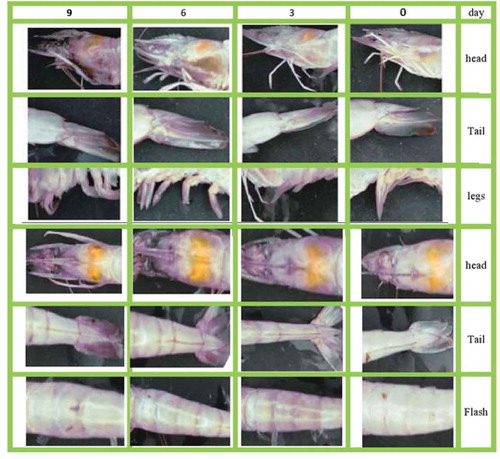
FIGURE 3 The color change of four groups of pacific white shrimps (litopenaeus vannamei) during 9 days of storage on ice.
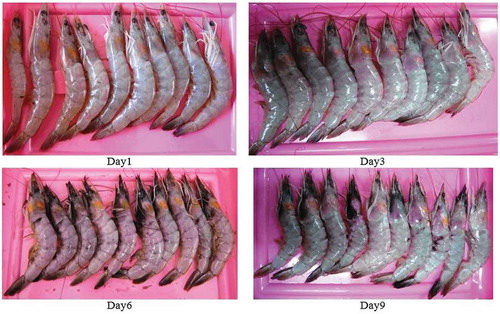
FIGURE 4 Variation of shrimp color parameters from side pictures during storage on ice; A: r, g, and b; B: h, s, and v; C: L*, a*, and b*; and D: c and h.Day: 1 = first day, 2 = third day, 3 = sixth day, 4 = ninth day; h = hue, c = chroma.
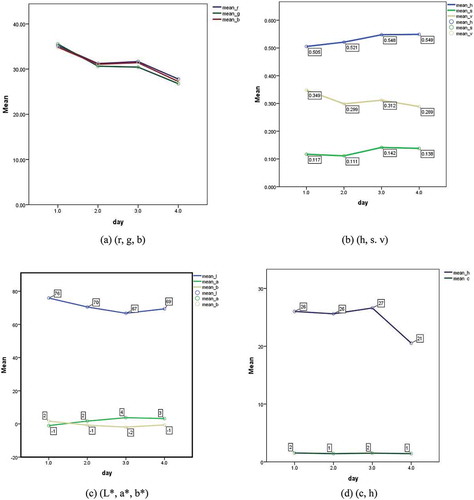
TABLE 4 Fisher weights of a single category (mean of three FW between pairs of categories), for some variables and the most discriminant sums of standardized variables
TABLE 5 Characteristics of the principal components. Pretreatment: column autoscaling
FIGURE 5 Correlation tree among the variables, shown as dendrogram of the similarities (correlation coefficients) obtained by means of the single linkage method. The arrow indicates the group of much correlated variables.
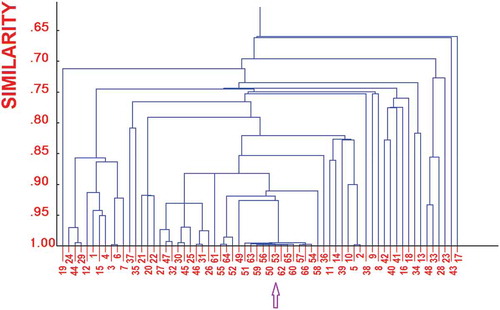
FIGURE.6 Score plot on the two first principal components of all 66 variables (autoscaled). Red: Class1, Blue: Class 2, Green: Class 3, Magenta: Class 4. The convex hulls indicate the dispersion of the classes.
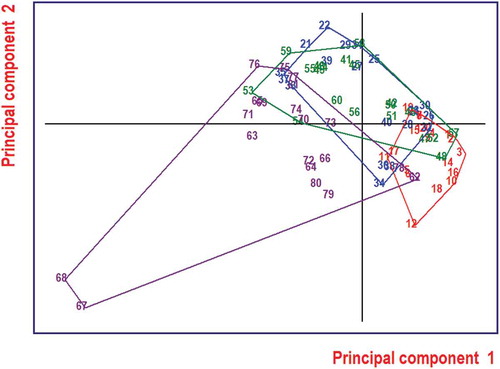
FIGURE 7 Score plot on the two first principal components of the 14 variables/features (autoscaled). Red: class 1, Blue: class 2, Green: class 3, Magenta: class 4.
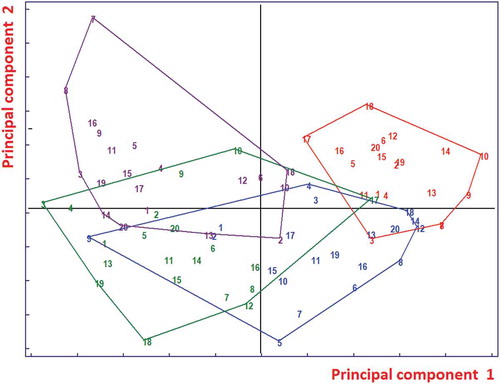
FIGURE 8 Plots of the differences between scores of LDA. Red: class 1, Blue: class 2, Green: class 3, Magenta: class 4.
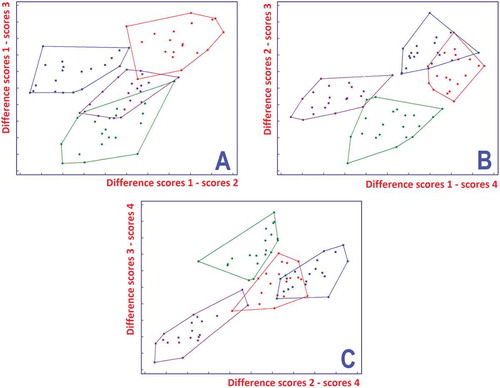
TABLE 6 Classification and prediction rates of KNN (K = 1), applied to all the autoscaled variables
FIGURE 9 95% confidence ellipses computed with T2 statistics in the space of the two first components.
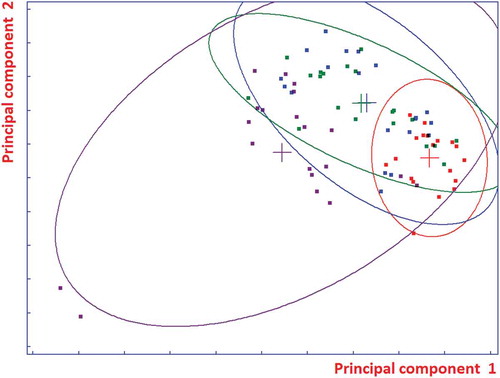
TABLE 7 Classification and prediction rates of D-PLS (eight latent variables), applied to all the autoscaled variables
TABLE 8 Classification and prediction rates of LDA applied to the four features selected by means of multivariate classification trees