Figures & data
FIGURE 1 Sample locations of a grass carp (each cut was 4 cm width).
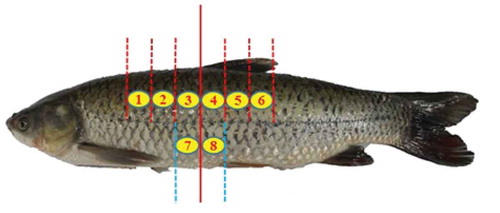
FIGURE 2 Effects of locations of fish muscle portions on a: moisture, b: protein, and, c: fat content of white muscle (n = 4), and d: difference in moisture content at different locations of four fish ( shows the portions and front side of the fish). No significant difference in composition was found in different portions except that the lipids content in portions 7 and 8 (Fig. 2c) were significant different from that in portions 1–6.
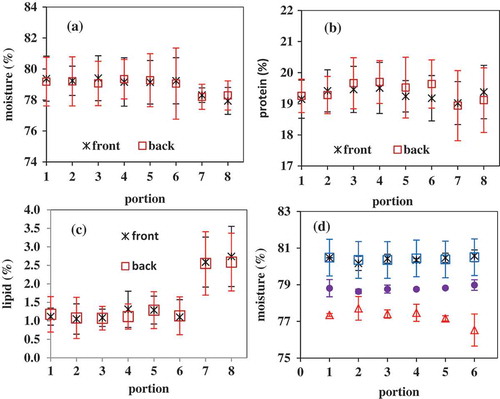
FIGURE 3 Change in pH and TVB-N of fish muscle during ice storage (n = 4). The vertical bars represent the standard deviations. The pH values or TVB-N with different letters were significant different (p ˂ 0.05).
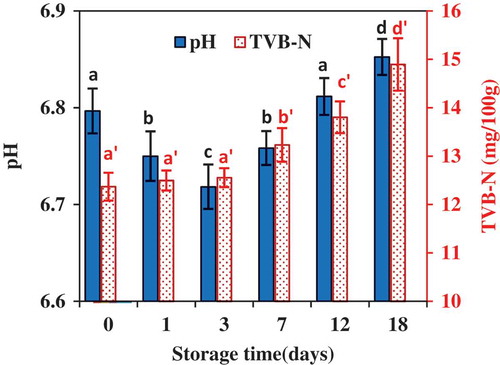
FIGURE 4 Change in total soluble proteins and drip loss of fish muscle during ice storage. The vertical bars represent the standard deviations (n = 4).
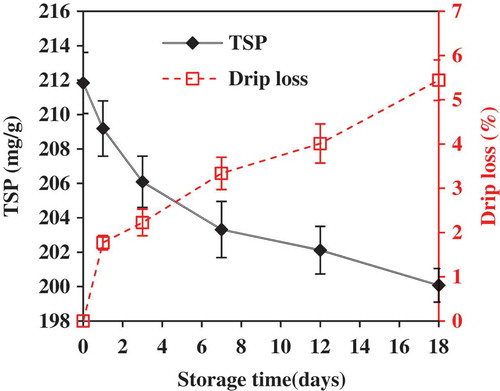
FIGURE 5 Cook loss of fish muscle as affected by ice storage time (0–18 d) and the severity of heat treatment (n = 3).
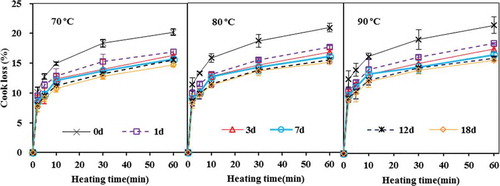
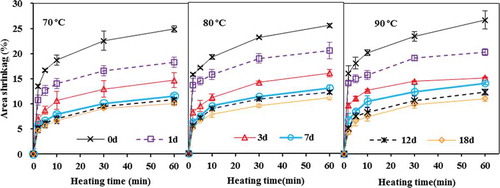
FIGURE 6 Area shrinkage of fish muscle as affected by ice storage time (0–18 d) and the severity of heat treatment (n = 3).