867
Views
0
CrossRef citations to date
0
Altmetric
Original Articles

Biochemical Variations in Salt Soluble Fractions of Ultrasonicated Actomyosin Isolated from Broiler Breast-Muscle

, &
Pages 2284-2296 | Received 03 May 2015, Accepted 08 Dec 2015, Published online: 16 Jun 2016

Figures & data

FIGURE 1 (a) Time course of changes in protein solubility of sonicated AM as 0.6M NaCl solution after post-exposure dilutions to different NaCl molarities. Starting point (zero) of each curve is the protein concentration of control supernatant at each NaCl dilution. (n = 5; p < 0.05; SE ± 2–5); (b) Salt concentration-dependence of sonicated-AM solubility (continuous line) showing shift to lower NaCl molarity. Opposite behavior of solubility displayed by unsonicated AM at different dilutions of NaCl is displayed as dotted line. (n = 5; p < 0.05; SE ± 2–5).
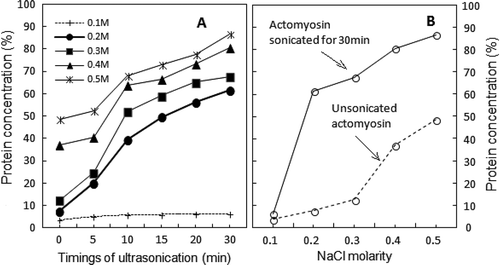
FIGURE 1 (a) Time course of changes in protein solubility of sonicated AM as 0.6M NaCl solution after post-exposure dilutions to different NaCl molarities. Starting point (zero) of each curve is the protein concentration of control supernatant at each NaCl dilution. (n = 5; p < 0.05; SE ± 2–5); (b) Salt concentration-dependence of sonicated-AM solubility (continuous line) showing shift to lower NaCl molarity. Opposite behavior of solubility displayed by unsonicated AM at different dilutions of NaCl is displayed as dotted line. (n = 5; p < 0.05; SE ± 2–5).

FIGURE 2 SDS-PAGE profiles of proteins in sonication solubilised AM at various NaCl dilutions (Srf). Equal volume (10 µL) of each sample was loaded in individual pocket. Notation sequence below the lanes 1-2 shows: Srf = Standard reference (0.6 M NAM); C = Supernatant of unsonicated control at corresponding dilution. Subsequent notations (5, 10, 15, 20, and 30) indicate time in minutes at which supernatants were obtained. MyHC = Myosin heavy chain (200 kDa); Actin (46 kDa); Tm (Tropomyosin) = 37; Tn T (Troponin T) = 35; Tn I (Troponin I) = 24; Tn C (Troponin C) = 20; MLC I (Myosin light chain I) = 26; MLC II = 18; MLC III = 16.
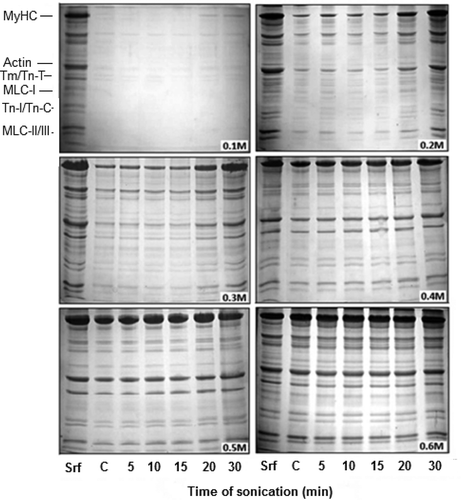
FIGURE 2 SDS-PAGE profiles of proteins in sonication solubilised AM at various NaCl dilutions (Srf). Equal volume (10 µL) of each sample was loaded in individual pocket. Notation sequence below the lanes 1-2 shows: Srf = Standard reference (0.6 M NAM); C = Supernatant of unsonicated control at corresponding dilution. Subsequent notations (5, 10, 15, 20, and 30) indicate time in minutes at which supernatants were obtained. MyHC = Myosin heavy chain (200 kDa); Actin (46 kDa); Tm (Tropomyosin) = 37; Tn T (Troponin T) = 35; Tn I (Troponin I) = 24; Tn C (Troponin C) = 20; MLC I (Myosin light chain I) = 26; MLC II = 18; MLC III = 16.

FIGURE 3 Densitometric analysis of selected SDS-PAGE profiles of supernatants from 0.2 to 0.5 M dilutions of sonicated-AM, showing change in of MyHC and Actin with the increasing time of sonication (x-axis). Out of each set of bars, 1st, 2nd, and 3rd bar represent IDV of MyHC, expected IDV of actin (calculated according to formula given under “Materials and Methods”) and actually observed IDV of actin, respectively (±1–4%).
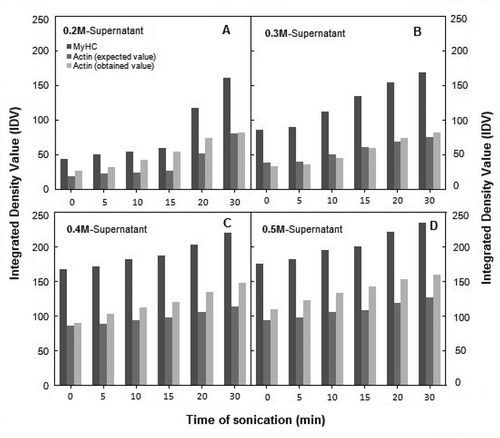
FIGURE 3 Densitometric analysis of selected SDS-PAGE profiles of supernatants from 0.2 to 0.5 M dilutions of sonicated-AM, showing change in of MyHC and Actin with the increasing time of sonication (x-axis). Out of each set of bars, 1st, 2nd, and 3rd bar represent IDV of MyHC, expected IDV of actin (calculated according to formula given under “Materials and Methods”) and actually observed IDV of actin, respectively (±1–4%).

FIGURE 4 Comparison of the effect of ultrasonication on solubility profiles of MyHC (a) and actin (b and c) in supernatants at various dilutions of sonicated AM. IDVs are plotted after conversion to percent of respective controls (unsonicated AM dilutions; ±2–10%).
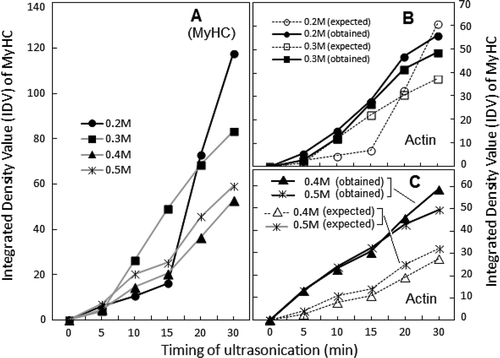
FIGURE 4 Comparison of the effect of ultrasonication on solubility profiles of MyHC (a) and actin (b and c) in supernatants at various dilutions of sonicated AM. IDVs are plotted after conversion to percent of respective controls (unsonicated AM dilutions; ±2–10%).

FIGURE 5 Exposure time dependence of ultrasonication-induced changes in Ca2+-ATPase and K+ (EDTA)-ATPase activities recorded for soluble fractions of actomyosin at various NaCl dilutions (frames a and b). Changes in Mg2+-ATPase activity are compared in frames c–d. Symbols for individual ATPase activity are given with notations in each frame. To facilitate comparison, ATPase activities were converted to percent of respective controls of the same dilutions of chicken AM (±3–10%).
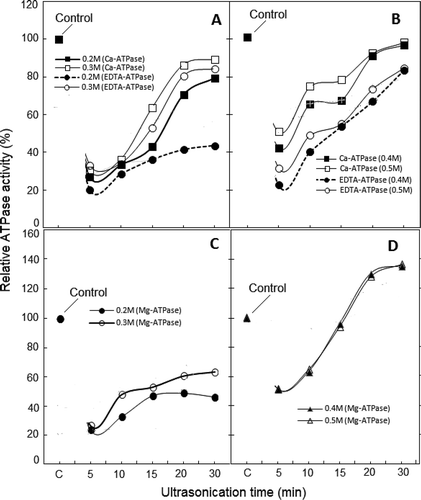
FIGURE 5 Exposure time dependence of ultrasonication-induced changes in Ca2+-ATPase and K+ (EDTA)-ATPase activities recorded for soluble fractions of actomyosin at various NaCl dilutions (frames a and b). Changes in Mg2+-ATPase activity are compared in frames c–d. Symbols for individual ATPase activity are given with notations in each frame. To facilitate comparison, ATPase activities were converted to percent of respective controls of the same dilutions of chicken AM (±3–10%).

FIGURE 6 UV spectra of soluble fractions obtained at 0.2–0.6 M NaCl dilutions of ultrasonicated 0.6 M NaCl-soluble AM, taken after various exposure timings. Thick continuous line represents 15 min supernatant, where ~286 nm maximum assumes shape of peak beyond 0.3 M NaCl. Spectra in frame d represent unpartitioned sonicated AM soluble in 0.6 M NaCl.
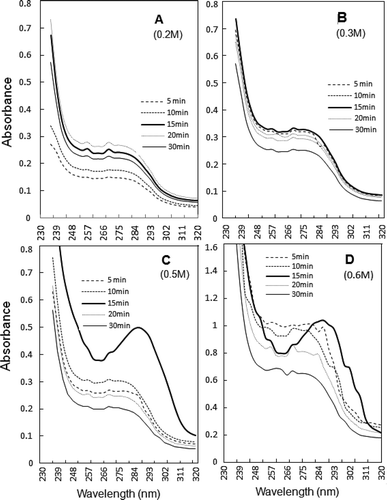
FIGURE 6 UV spectra of soluble fractions obtained at 0.2–0.6 M NaCl dilutions of ultrasonicated 0.6 M NaCl-soluble AM, taken after various exposure timings. Thick continuous line represents 15 min supernatant, where ~286 nm maximum assumes shape of peak beyond 0.3 M NaCl. Spectra in frame d represent unpartitioned sonicated AM soluble in 0.6 M NaCl.
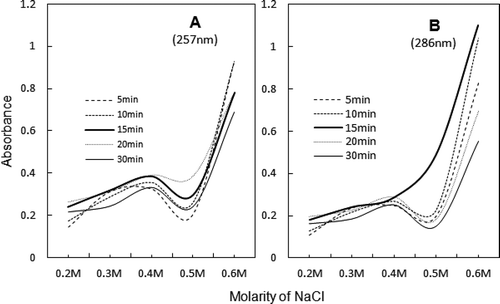
FIGURE 7 Comparison of sonic exposure and salt-dependence of the peak absorbance values at ~257 and ~286 nm of UV spectra, shown in .

FIGURE 7 Comparison of sonic exposure and salt-dependence of the peak absorbance values at ~257 and ~286 nm of UV spectra, shown in Fig. 6.

Reprints and Corporate Permissions

Please note: Selecting permissions does not provide access to the full text of the article, please see our help page How do I view content?

To request a reprint or corporate permissions for this article, please click on the relevant link below:

Academic Permissions

Please note: Selecting permissions does not provide access to the full text of the article, please see our help page How do I view content?

Obtain permissions instantly via Rightslink by clicking on the button below:

If you are unable to obtain permissions via Rightslink, please complete and submit this Permissions form. For more information, please visit our Permissions help page.