Figures & data
Table 1. Decimal reduction concentrations (Dc, µg/mL) values of for nanopowders and essential oils for selected microorganisms.
Figure 1. Typical survival curves of food borne pathogens at different concentrations of nanopowders (A: L. monocytogenes; B: S. typhimurium; C: E. coli O157:H7).
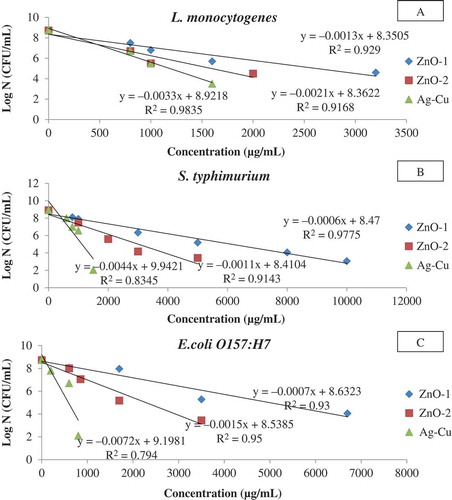
Figure 2. Typical survival curves of foodborne pathogens at different concentrations of essential oils (A: L. monocytogenes; B: S. typhimurium; C: E. coli O157:H7).
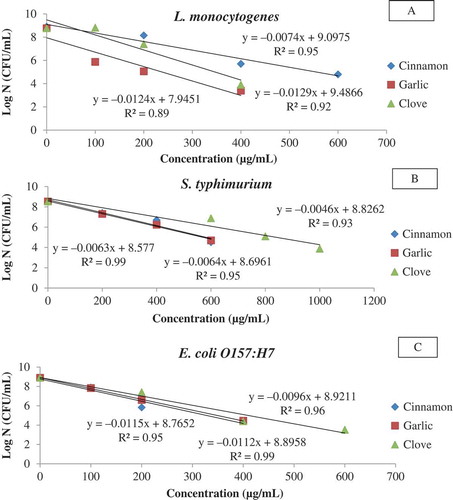
Table 2. Minimum bactericidal concentrations (MBC, µg/mL) of nanopowders and essential oils for selected microorganisms.
Table 3. Measured zones of inhibition (mm) of PLA based films against three foodborne pathogens.
TAble 4. Survivor counts (CFU/mL) and of three foodborne pathogens after 24 and 48 h of incubation of PLA based films in TSB.
Figure 3. Log reductions of food borne pathogens after 24 and 48 h incubation of PLA based films in TSB (A: L. monocytogenes; B: S. typhimurium; C: E. coli O157:H7).
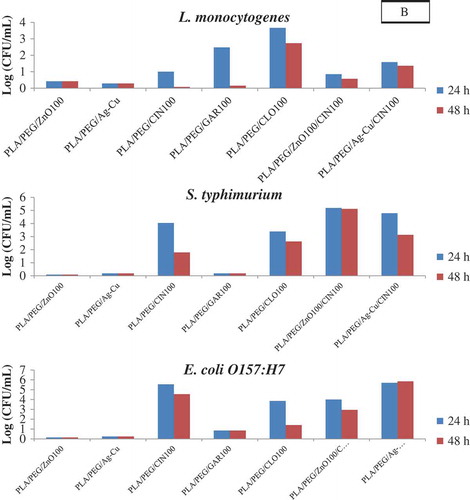
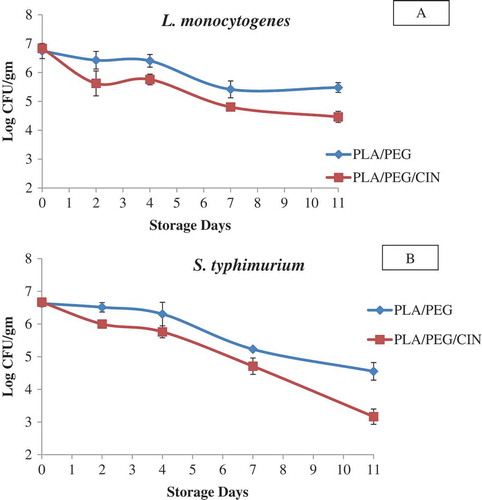
Figure 4. Growth of A: L. monocytogenes and B: S. typhimurium in cheese samples wrapped with PLA/PEG/CIN100 and PLA/PEG films and stored at 4°C for 11 days.