
Figures & data
Table 1. Mathematical growth models used to predict growth of S. aureus.
Figure 1. Growth curves of S. aureus on pork. a: Growth curves of S. aureus on pork at constant temperature (20°C) obtained using a conventional microbiological method and real-time PCR; b: Growth curves of S. aureus on pork at constant temperature (25°C) obtained using a conventional microbiological method and real-time PCR; c: Growth curves of S. aureus on pork at constant temperature (30°C) obtained using a conventional microbiological method and real-time PCR. The empty red circles represent the mean values of quintuplicate trials of raw data points using a conventional microbiological method; the solid red circles represent the mean values of quintuplicate trials of raw data points using real-time PCR. The red lines represent the modified Gompertz model; the black lines represent the Logistic model; the blue lines represent the Richards model.
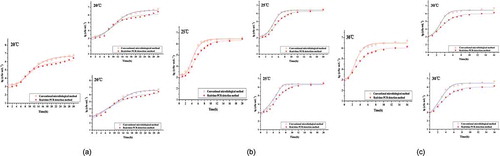
Table 2. The growth parameters of S. aureus on pork calculated from modified Gompertz equation, modified Logistic equation, and Richards equation using a conventional microbiological method and real-time PCR.
Table 3. The secondary models (specific growth rate and lag phase) of S. aureus on pork at constant temperature (7 ~ 30°) obtained using real-time PCR and conventional microbiological method.
Figure 2. Lag time of S. aureus in pork at constant temperature (7 ~ 30°C) obtained using a conventional microbiological method and real-time PCR. The solid red triangles represent the mean values of quintuplicate trials of raw data points using a conventional microbiological method; the solid red squares represent the mean values of quintuplicate trials of raw data points using real-time PCR. The red lines represent the modified Gompertz model; the black lines represent the Logistic model; the blue lines represent the Richards model.
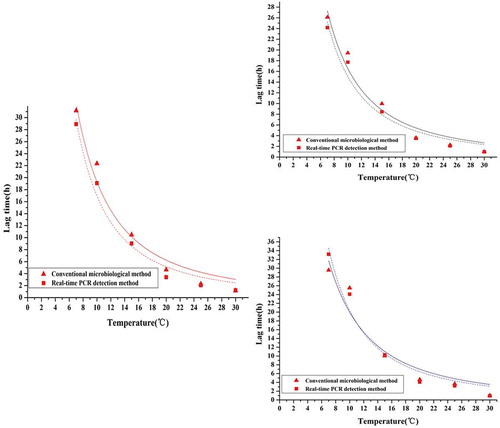
Figure 3. Specific growth rate of S. aureus in pork at constant temperature (7 ~ 30°C) obtained using a conventional microbiological method and real-time PCR. The solid red triangles represent the mean values of quintuplicate trials of raw data points using a conventional microbiological method; the solid red squares represent the mean values of quintuplicate trials of raw data points using real-time PCR. The red lines represent the modified Gompertz model; the black lines represent the Logistic model; the blue lines represent the Richards model.
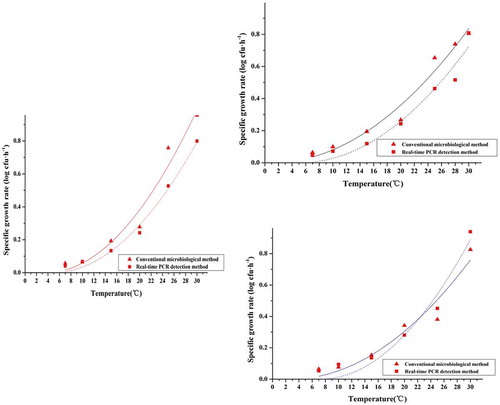
Table 4. Fitting evaluation of growth models (modified Gompertz, Logistic equation, and Richards model) by real-time PCR and conventional microbiological method.