Figures & data
Figure 1. Experimental procedure for automatic quality evaluation of black beans.
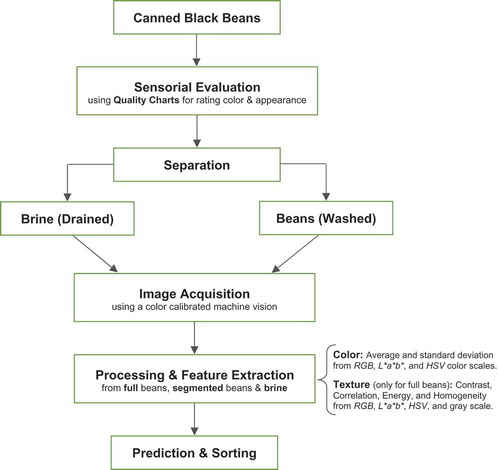
Figure 2. Color chart for black beans representing five typical categories found in commercial canned beans (note that the color categories were reproduced using the same bean image with different tones).
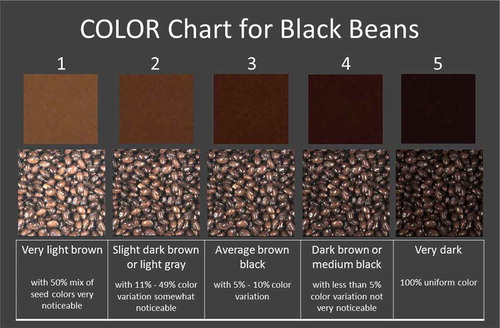
Figure 3. Appearance chart for black beans after drained representing five typical quality categories found in commercial canned beans.
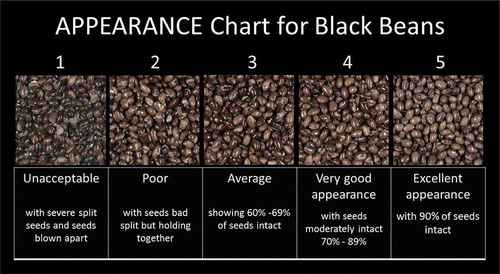
Figure 4. Original and preprocessed images of canned black beans and brine. A: Original color image after draining and washing, B: segmented beans from the original image (with black background), and C: brine.
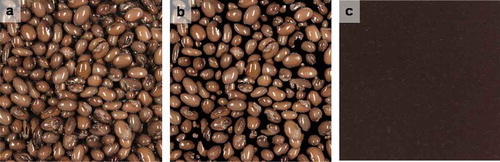
Figure 5. Relationship between CIE L*a*b* values (CIELAB D50 2° observer) for ColorChecker and CDC camera after transformations using a polynomial 20-by-3.
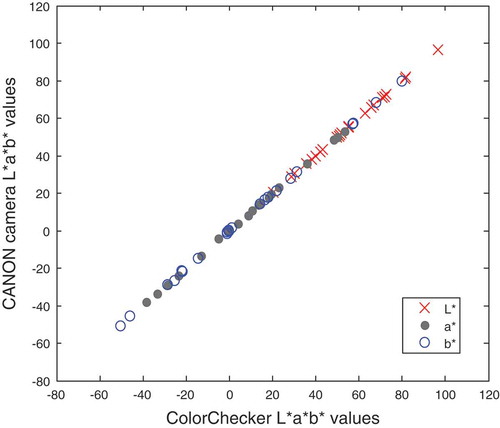
Figure 6. Distribution of visual appearance and color rates of canned black beans using the proposed color charts.
Table 1. Statistics of the data sets for color and appearance rates of the different types of canned black beans.
Table 2. Overall agreement and Kappa analysis among 17 panelists for visual color and appearance of canned black beans at different categories.
Table 3. Calibration and prediction results for color of canned black beans using the average pixel intensity data and standard deviation, and their texture image information extracted from R, G, B, L*, a*, b*, H, S, and V color scales.
Table 4. Calibration and prediction results for appearance of canned black beans using textural image information (i.e., contrast, correlation, energy, and homogeneity) and their combination with color information extracted from R, G, B, L*, a*, b*, H, S, and V color scales.
Figure 7. Predictions for visual color and appearance rates A and B, respectively, using color (segmented seed + brine) and image textural features (contrast, correlation, energy, homogeneity) extracted from RGB, L*a*b*, HSV, and gray intensity channels.
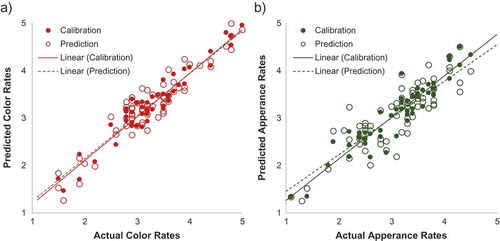
Table 5. Classification results of commercial canned black beans into “acceptable” and “unacceptable” qualities based on color, appearance, and their combination using color and textural image features.
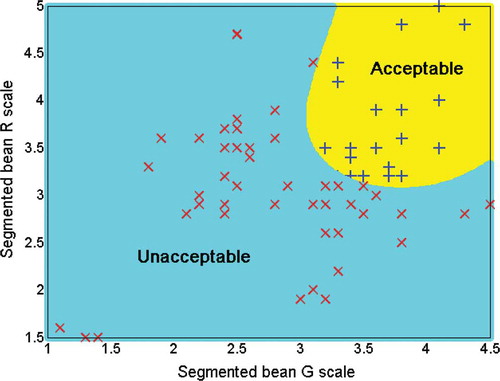
Figure 8. Example of using the two best selected image features by the sequential forward selection method in sorting by color and appearance commercial canned black beans into “acceptable” and “unacceptable” qualities. The decision line was carried out using a support vector machine classifier.