Figures & data
TABLE 1 List of primers used in this work
TABLE 2 DNA yield and mean number of quantification cycles obtained in porcine-specific and universal real time PCR using DNA extracted from lard-adulterated samples
FIGURE 1 Amplification plot and standard curve of 10-fold serially diluted porcine DNA, designated as (a) 1 ng, (b) 0.1 ng, (c) 0.01 ng, (d) 0.001 ng, and (e) 0.0001 ng; with Cq value of 16.89, 19.51, 22.91, 26.32 and 29.72, respectively.
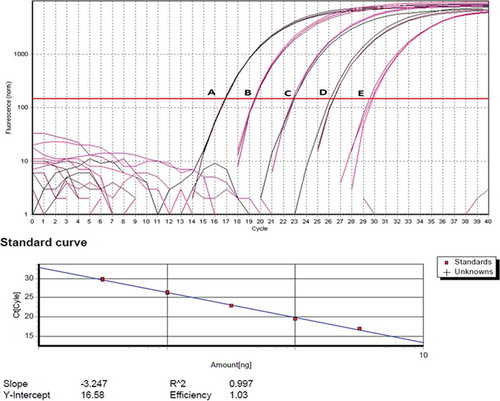
FIGURE 2 Amplification plot of lard-adulterated cocoa powder, milk powder, cocoa butter and icing sugar using porcine-specific real-time PCR assay. Only lard-adulterated cocoa powder failed to give positive amplification.
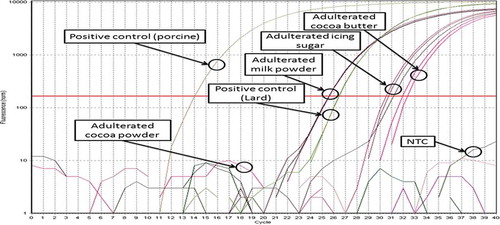
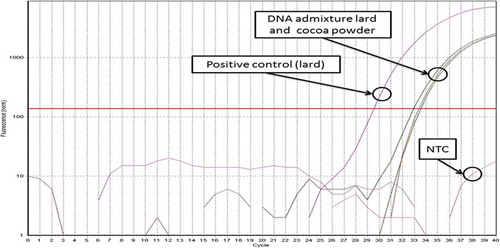
FIGURE 3 Amplification plot of binary DNA admixture containing mixture of DNA from pure lard and DNA from cocoa powder. Positive amplification being obtained proves that the extracted DNA is applicable for PCR (free or insignificant amount of PCR inhibitor).