
Figures & data
FIGURE 1 SDS-PAGE profiles of three protein samples stained for (a) protein and (b) saccharide fractions. Lane M, standard protein markers; lane 1, horseradish peroxidase; lane 2, sodium caseinate; lane 3, GC-caseinate I; lane 4, GC-caseinate II. The arrows indicate protein polymers.
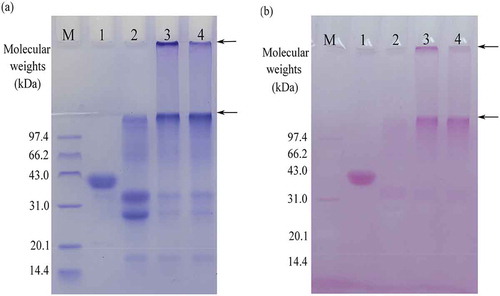
FIGURE 2 FT-IR spectra of sodium caseinate, GC-caseinate I and II.
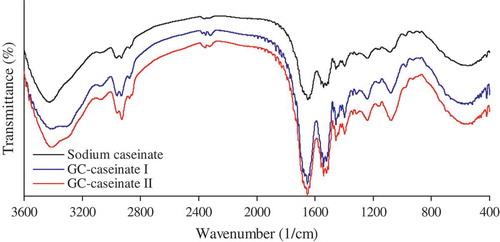
FIGURE 3 CD spectra of sodium caseinate, GC-caseinate I and II dispersed in a phosphate buffer (10 mmol/L, pH 7.0) at 0.1 g/L.
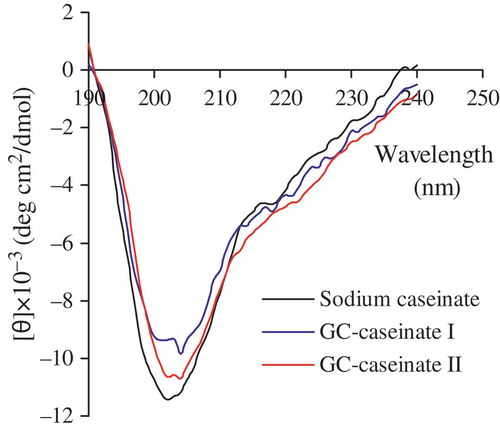
FIGURE 4 (a) Original thermogravimetric (TG) curves for sodium caseinate, GC-caseinate I and II, and (b) the respective derivative function (DTG) versus temperatures ranging from ambient temperature to 450°C.
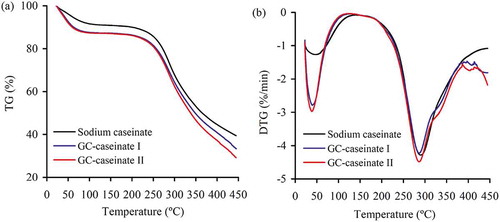
TABLE 1 Some thermogravimetric parameters of sodium caseinate, GC-caseinate I and II
FIGURE 5 Distribution profiles of the hydrodynamic radius of sodium caseinate, GC-caseinate I and II dispersed in a phosphate buffer (10 mmol/L, pH 7.0) at 1.0 g/L. PSD, particle size distribution.
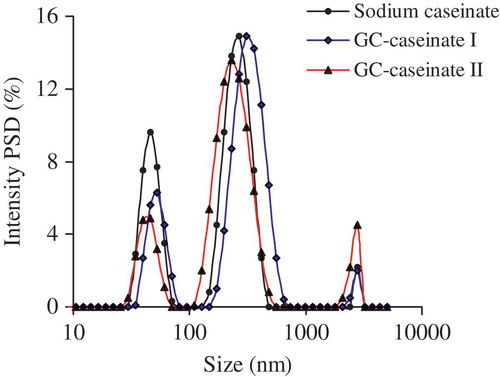
TABLE 2 Some properties of sodium caseinate, GC-caseinate I and II