
Figures & data
Table 1. Mean values of wheat flour properties.
Figure 1. The effect of yeasts type on the gas production volume (mL/3 h). Different letters indicate a significant difference (p < 0.05) between the treatments.
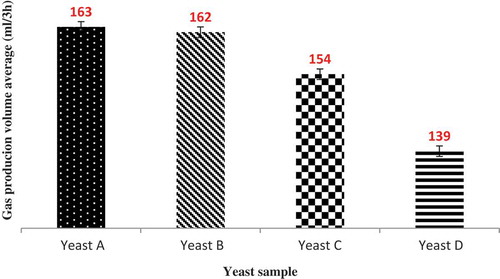
Figure 2. The effect of yeasts type on the gas production pressure (mbar/3 h). Different letters indicate a significant difference (p < 0.05) between the treatments.
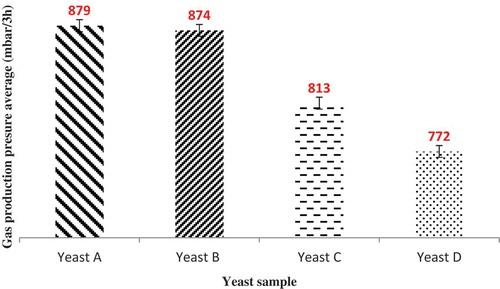
Figure 3. Live yeasts in yeast–water suspention shown in epifluorescence light microscopy after staining with FDA. Magnification: × 10.
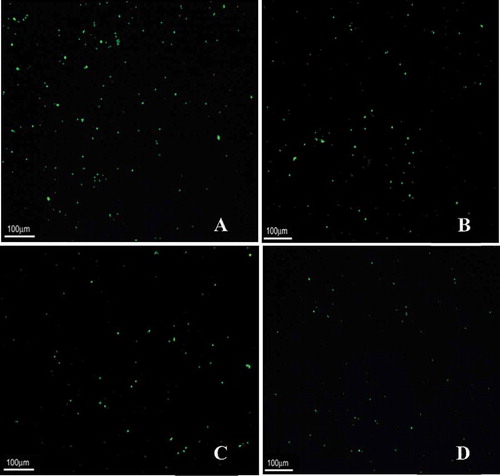
Table 2. Pearson’s simple correlation between all of the tests.