Figures & data
Table 1. Statistics of both calibration and prediction data sets for some physical properties of pomegranate fruit samples.
Figure 1. Fruit and arils of pomegranate (cv. “Ashraf”) cultivar.
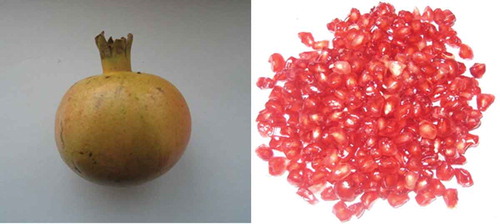
Figure 2. The constructed multispectral imaging system for acquiring images from the fruit.
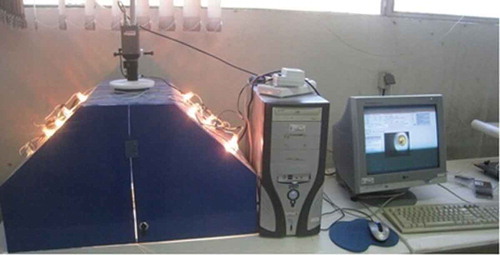
Table 2. Statistics values of TSS, TA, and pH of 100 pomegranate samples.
Figure 3. The average raw reflectance Vis/NIR spectra of A: Ashraf pomegranate fruit, and B: its absorbance spectrum.
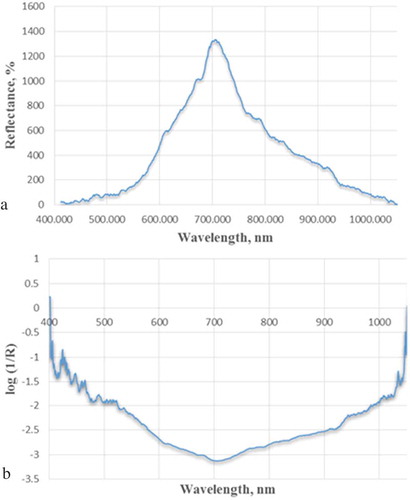
Figure 4. Prediction of TSS, TA, and pH using PLS models: A: predicted residual error sum of squares (PRESS) for predicting TSS, TA, and pH as a function of number of factors; B: measured and predicted TSS values for training and validation sets using nine factors; C: measured and predicted pH values for training and validation sets using four factors; and D: measured and predicted TA values for training and validation sets using six factors.
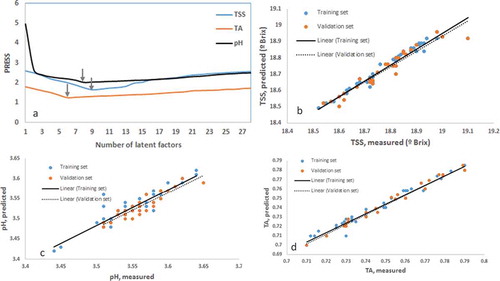
Table 3. PLS models for predicting TSS, TA, and pH in pomegranate.
Table 4. MLR models for predicting TSS, TA, and pH in pomegranate.
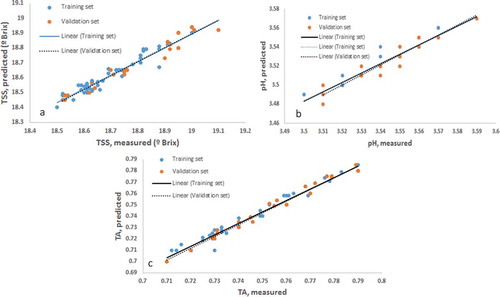
Figure 5. Prediction of TSS, TA, and pH using MLR models: A: correlation between measured TSS and estimated TSS for training and validation sets; B: correlation between measured pH and estimated pH for training and validation sets; C: correlation between measured TA and estimated TA for training and validation sets.