Figures & data
Table 1. Chemical compositions (% dry weight basis) of culinary banana starch.
Table 2. Water holding capacity, swelling and solubility profile of culinary banana starch (%).
Figure 1. A: Culinary banana at matured edible stage and B: starch from culinary banana.
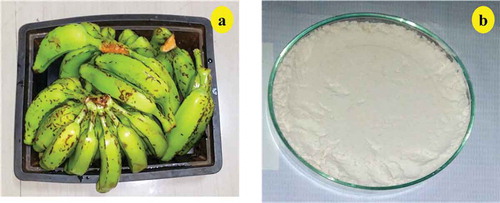
Figure 2. A: Freeze-thaw stability of culinary banana starch and B: paste-clarity of culinary banana starch.
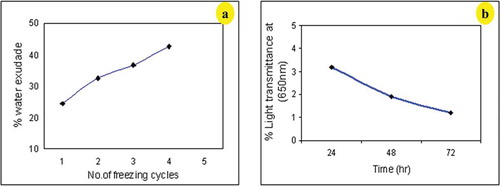
Figure 3. Pasting properties of culinary banana starch.
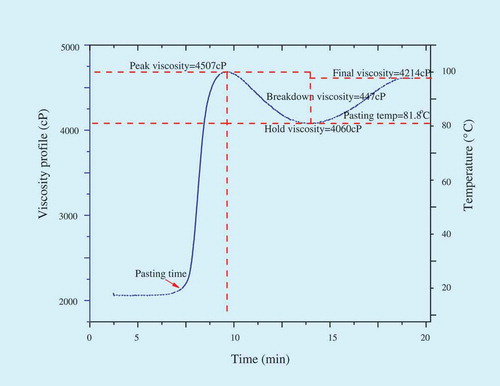
Figure 4. X-ray diffractogram of culinary banana starch.
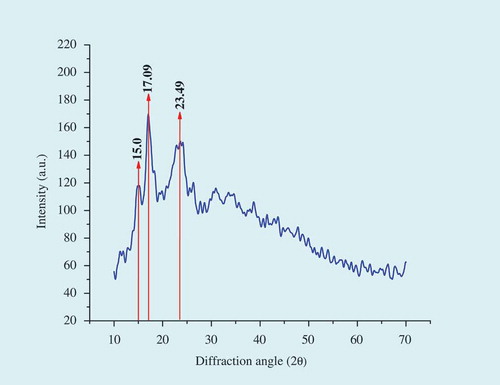
Figure 5. FT-IR spectra of culinary banana starch.
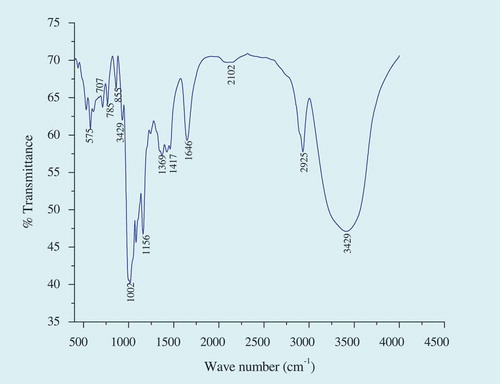
Figure 6. Scanning electron micrograph of culinary banana starch.
Figure 7. TGA and DTG curves of culinary banana starch.
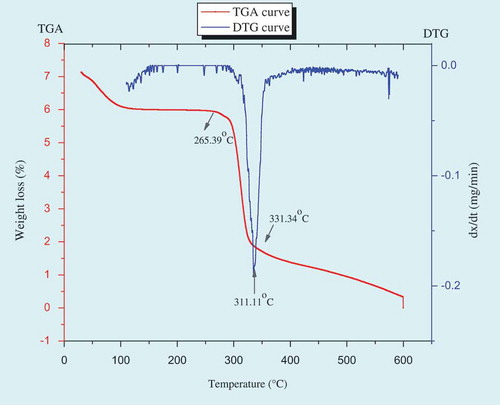
Table 3. Effect of starch concentration and number of autoclaving and cooling cycles on RS content.
Figure 8. Resistant starch (RS) obtained by A: hydrothermal process and B: enzyme debranching.
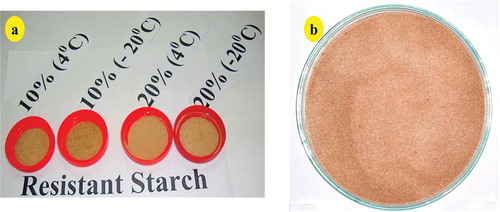
Table 4. Effect of storage temperature on resistant starch content.
Table 5. Chemical compositions (% dry weight basis) of culinary banana RS.
Figure 9. Scanning electron micrograph of culinary banana RS A: (RS10-B = 10%, –20°C); B: (RS20-B = 20%, –20°C); and C: (RSEz-B = 24 h, –20°C).
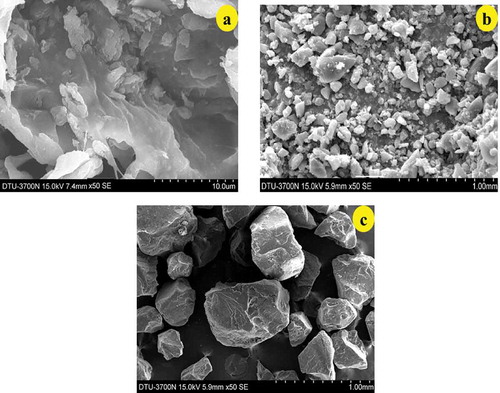
Figure 10. FT-IR spectra of RS obtained after hydrothermal (RS10-B = 10%, –20°C and RS20-B = 20%, –20°C) and enzyme debranched (RSEz-B = 24 h, –20°C).
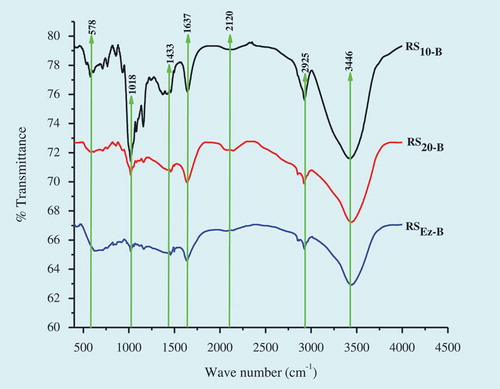
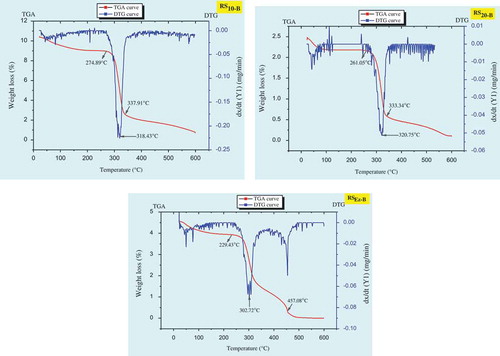
Figure 11. TGA and DTG curves of RS obtained after hydrothermal (RS10-B = 10%, –20°C and RS20-B = 20%, –20°C) and enzyme debranched (RSEz-B = 24 h, –20°C).