Figures & data
Figure 1. Experimental protocol for the study of effect of pH alteration of milk on casein micelle size and properties.
Figure 2. Mean casein micelle size of A: alkaline adjusted and restored milk, together with the picture of B: alkali adjusted and C: alkali restored milk (C). The pHs of the restored samples were reformed to 6.6 prior to size measurements.
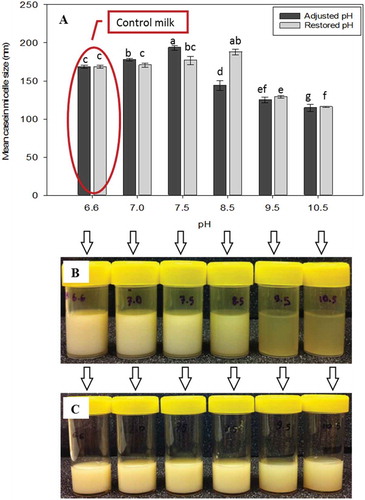
Table 1. The polydispersity index (pdI) of casein micelles of alkaline adjusted and restored milk.
Figure 3. Mean casein micelle size of acid adjusted and restored milk. The pHs of the restored samples was reformed to 6.6 prior to size measurements.
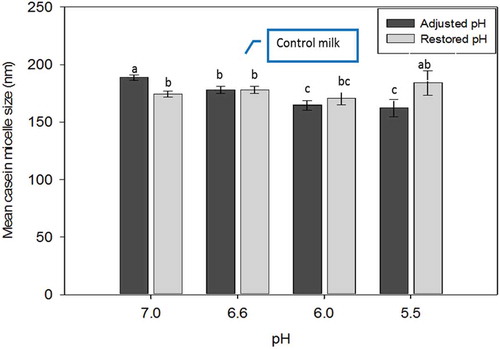
Figure 4. TEM micrographs of milk sample at pH A: 6.62; B: 6.0; and C: 5.5. Bars = 200 nm.
Table 2. The polydispersity index (pdI) of casein micelles of acid adjusted and restored milk.
Figure 5. Schematic diagram of changes in casein micelle size at various pHs. The pH of control milk is presented in red.
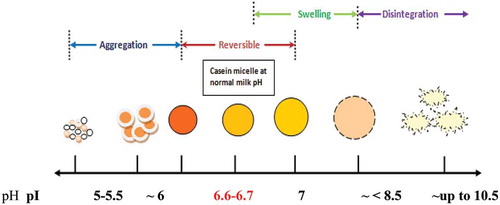
Table 3. Casein micelle size, soluble Ca in serum milk, ethanol stability and whiteness of control milk, adjusted to pH 7.0 and 6.0 with restoration back to pH 6.6.
Figure 6. Effects of GDL addition on the elastic modulus as A: a function of time and B: subsequent temperature sweep on the elastic modulus of gels made from adjusted milk to pH (■) 7.0; (●) 6.6; (▲) 6.0, and restored milk from pH (□) 7.0 and (Δ) 6.00. Control milk is presented in red. Gels were made at 30°C for 6 h. Curves show representative samples.
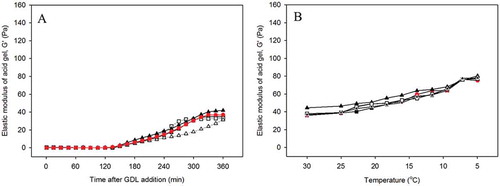
Table 4. Effect of glucono-δ-lactone (GDL) addition on the properties of acid-induced gels made from adjusted and restored milk. Gels were formed at 30°C for 6 h.
Figure 7. A: Gel hardness and B: syneresis of acid-induced gels made from adjusted and restored milk pH. Gels were formed at 30°C for 6 h.
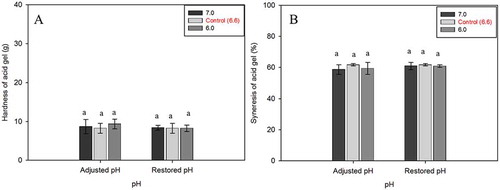
Figure 8. Effect of rennet addition on the elastic modulus as a A: function of time and B: subsequent temperature sweep on the elastic modulus of gels made from adjusted milk to pH (■) 7.0; (●) 6.6; (▲) 6.0, and restored milk from pH (□) 7.0 and (Δ) 6.00. Control milk is presented in red. Gels were made at 30°C for 6 h. Curves show representative samples.
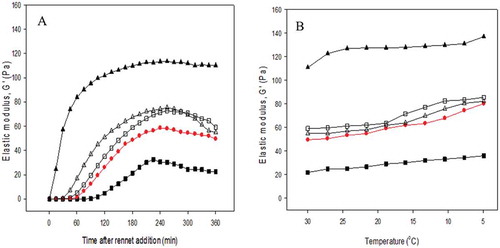
Table 5. Effect of rennet addition on the properties of rennet-induced gels made from adjusted and restored milk. Gels were formed at 30°C for 6 h.
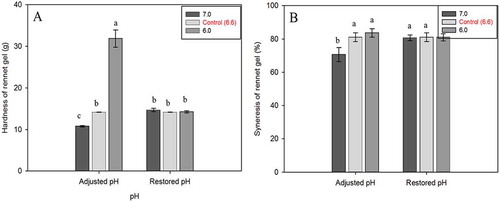
Figure 9. A: Gel hardness and B: syneresis of rennet-induced gels made from adjusted and restored milk pH. Gels were formed at 30°C for 6 h.