
Figures & data
Table 1. Experimental design scheme for optimization studies.
Table 2. CCD for the three independent variables.
Figure 1. The tree-dimension response surface plots (3D) and normal plot of the residuals of percentage of LLL (Y) for microwave heating, X1: temperature; X2: the amount of α-tocopherol; X3: contact time.
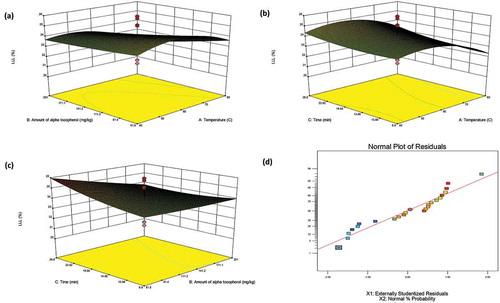
Figure 2. The tree-dimension response surface plots (3D) and normal plot of the residuals of total trans fatty acid (Y) for microwave heating, X1: temperature; X2: the amount of α-tocopherol; X3: contact time.
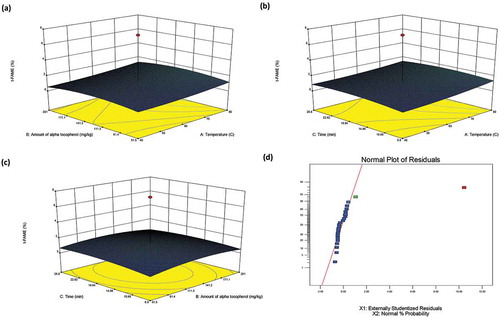
Figure 3. The tree-dimension response surface plots (3D) and normal plot of the residuals of percentage of LLL (Y) for conventional heating, X1: temperature; X2: the amount of α-tocopherol; X3: contact time.
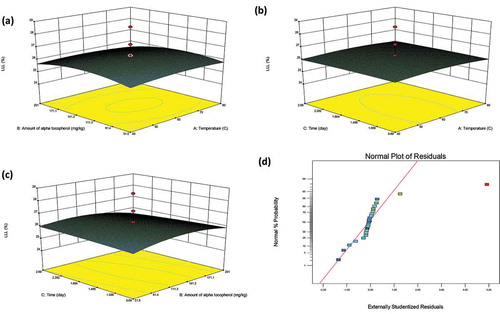
Figure 4. The tree-dimension response surface plots (3D) and normal plot of the residuals of total trans fatty acid (Y) for conventional heating, X1: temperature; X2: the amount of α-tocopherol; X3: contact time.
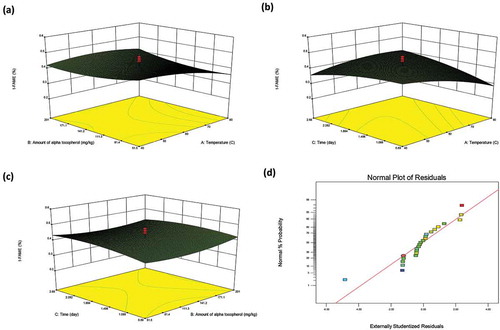
Table 3. Triglyceride composition (%) values for microwave heating experiments of corn oil.
Table 4. Triglyceride composition (%) values for conventional heating experiments of corn oil.
Table 5. Fatty acid composition (%) values for microwave heating experiments of corn oil.
Table 6. Fatty acid composition (%) values for conventional heating experiments of corn oil.