
Figures & data
Table 1. Description of meat, fish, and other samples used in the study.
Figure 1. Specificity analysis of macaque-specific primer pair against various primates and non-primates species. Shown are gel image of 18 meat species A: phylogenetic tree of 13 Macaca (Genera Cercopithecinae; 1–13), 20 Colobines species (Genera Presbytis, Trachypithecus, Semnopithecus, Rhinopithecus, Nasalis, Pygathrix, Colobus, and Procolobus; 14–33), and Homo sapiens (34) and 3D plot showing the discrimination of long-tailed Macaque facicularis target in the primer binding sites of 51 species (c). In A: Lane L: 100 bp Ladder; Lane 1–18: 120 bp PCR products from 10 ng DNA template extracted from monkey, chicken, beef, chevon, lamb, buffalo, venison, duck, pork, quail, pigeon, salmon, carp, cod, turtle, dog, cat, and rat meats, respectively. Lane 19: negative control.
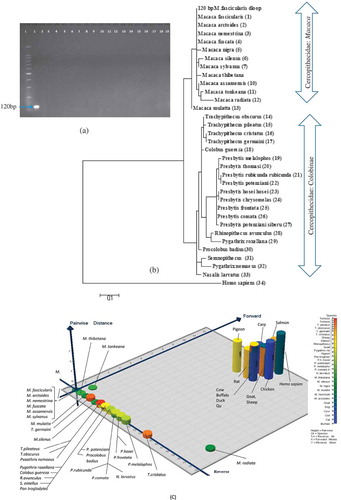
Figure 2. Sensitivity test under A: pure and B: monkey-beef, and C: monkey-goat binary admixtures under raw states.
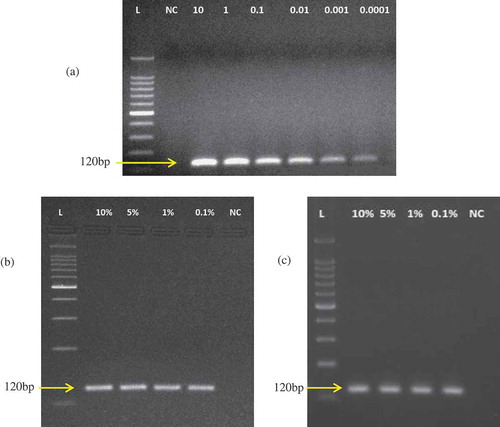
Figure 3. Marker DNA stability test under A: boiling, B: microwave cooking, and C: autoclaving treatments. In (A), lanes 1–6, 7–12, and 13–18 represent boiling at 60, 80, and 100°C, respectively, for 30 min. In (B), lanes 1–6, 7–12, and 13–18 represent microwave cooking at 300, 500, and 700 W, respectively, for 30 min. In (C), lanes 1–6, 7–12, and 13–18 represent autoclaving at 121°C for 30, 90, and 150 min, respectively. The six set of lanes in every treatment demonstrate PCR products from 10, 1, 0.1, 0.01, 0.001, and 0.0001 ng template DNA extracted from post-treated meats.
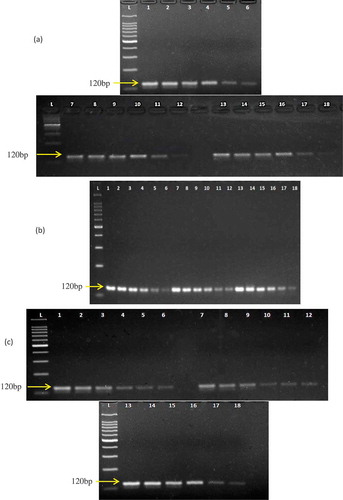
Figure 4. Restriction pattern analysis of monkey-target (120 bp) and endogenous control (141 bp) before (Lanes 1–3) and after AluI (Lane 4–6) and CViKI-I digestion. Lanes 1, 4, and 7: monkey; Lanes 2, 5, and 8: cow; and Lanes 3, 6, and 9: goat. Endogenous target (141 bp) was amplified from all species, reflecting good quality templates in all tubes and eliminating any false negative detection.
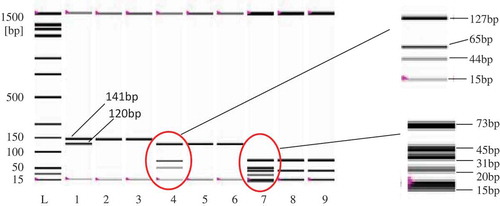
Table 2. The mismatch comparison of the long-tailed macaque specific forward and reverse primers against 27 species including 9 other macaque species.
Table 3. Pairwise distances of the Macaca fascicularis specific primer sites of D-loop gene against corresponding sites of 32 different tested species and most closely related species.